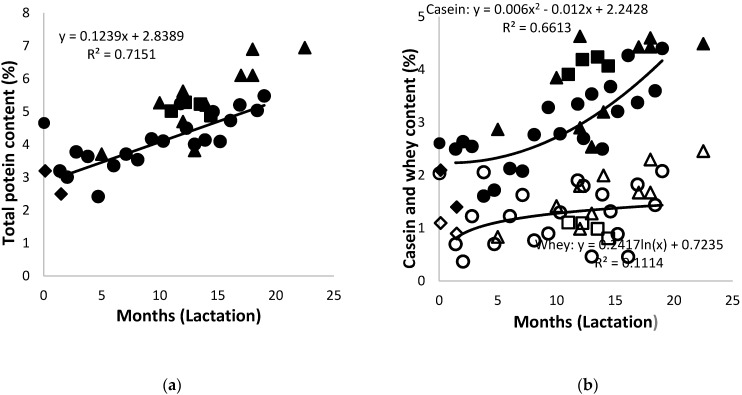
Figure 3.
(a) Changes of the total protein content lactation (Shorty (●), Bloem (♦) Mussina (■), and others (▲)) and (b) of casein (solid symbols) and whey proteins (open symbols) in milk of African elephants during lactation (Shorty (●○), Bloem (♦◊) Mussina (■□), and others (▲Δ)). The trend lines for combined data of all elephants were y = 0.0027x2 + 0.1076x + 2.9055 and R2 = 0.7153 for total protein, y = 0.126x + 1.8339 and R2 = 0.6089 for casein, and y = 0.0034x2 − 0.0243 + 1.0522; and R2 = 0.2815 for whey.

