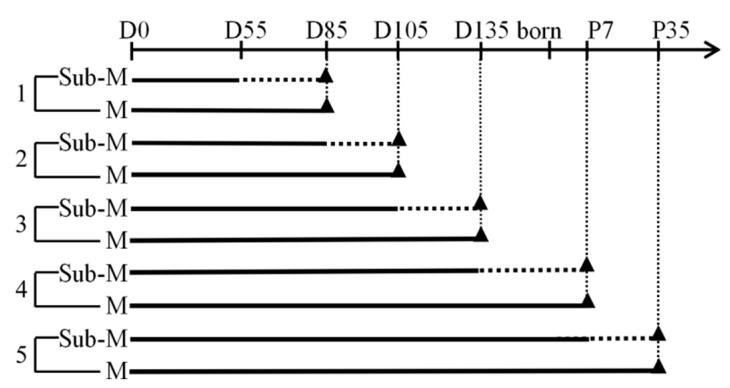
Figure 1.
Timelines of the maternal feed restriction experiment. The experiments were divided into five groups (1–5), each group included sub-maintenance (Sub-M) nutrition ewes (n = 3) and maintenance (M) nutrition ewes (n = 3). The timeline at the top of the diagram represents the gestational period. D0: day 0 of gestation; D55: days 55 of gestation; D85: days 85 of gestation; D105: days 105 of gestation; D135: days 135 of gestation; P7: postnatal day 7; P7: postnatal day 35. The solid line represents the maintenance nutrition feeding period, the dotted line represents the Sub-maintenance nutrition feeding period. Triangle represents sampling time points. The vertical dotted lines are used to align the sampling time points of the Sub-M and M.

