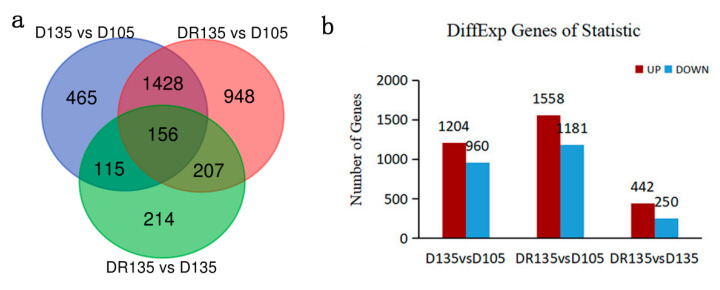
Figure 3.
Summary of DEGs. (a) Venn diagram illustrating the overlaps of DEGs between D135 vs. D105, DR135 vs. D105 and DR135 vs. D135. (b) Number of up-regulated and down-regulated expression genes between D135 vs. D105, DR135 vs. D105, and DR135 vs. D135. The x-axis represents the comparison scheme between the indicated different time points. The y-axis represents the corresponding number of DEGs. The red columns represent up-regulated expression genes and blue columns represent down-regulated expression genes.

