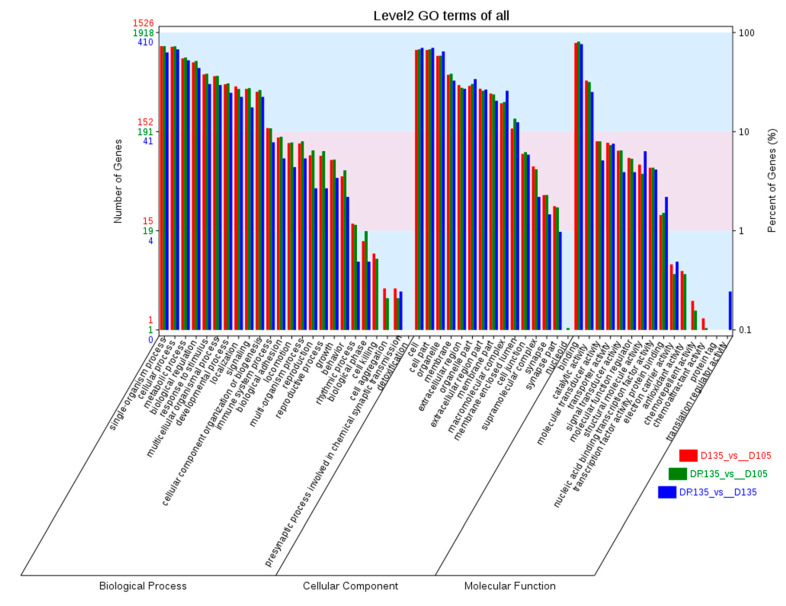
Figure 4.
A Gene Ontology (GO) functional enrichment analysis of DEGs. The x-axis shows the three categories of Gene Ontology; the y-axis shows the number of genes (left) and percent of genes (right). The red bars represent DEGs number in D135 vs. D105. The green bars represent DEGs number inDR135 vs. D105 and Blue bars represent DEGs number inDR135 vs. D135.

