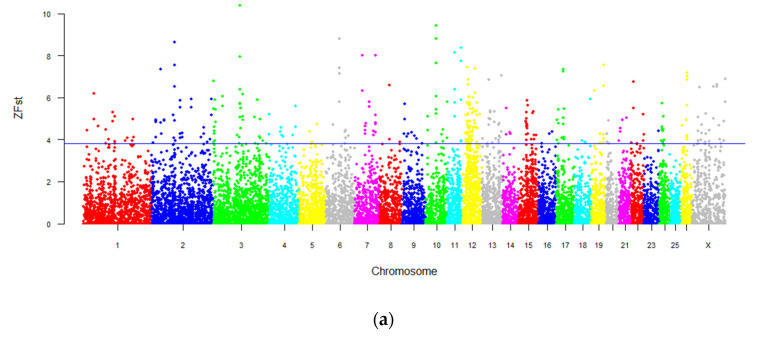
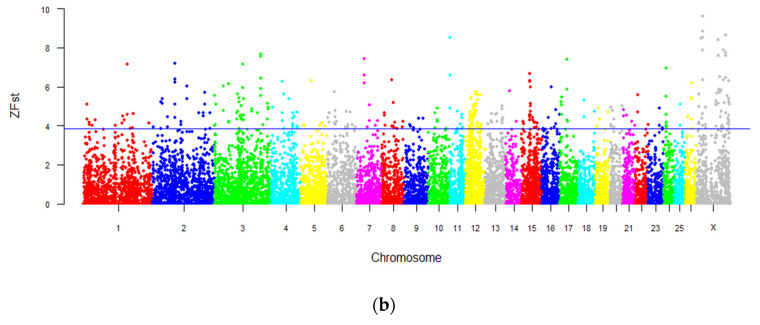
Figure 3.
The detection of genome-wide selection signals in intersex and normal populations. (a) The genome-wide distribution of ZFst between intersex sheep and normal sheep (including normal Lanzhou large-tailed sheep and Tan sheep). (b) The genome-wide distribution of ZFst between intersex and normal individuals of Lanzhou large-tailed sheep. Note: The blue line represents the top 1% of the ZFst value.


