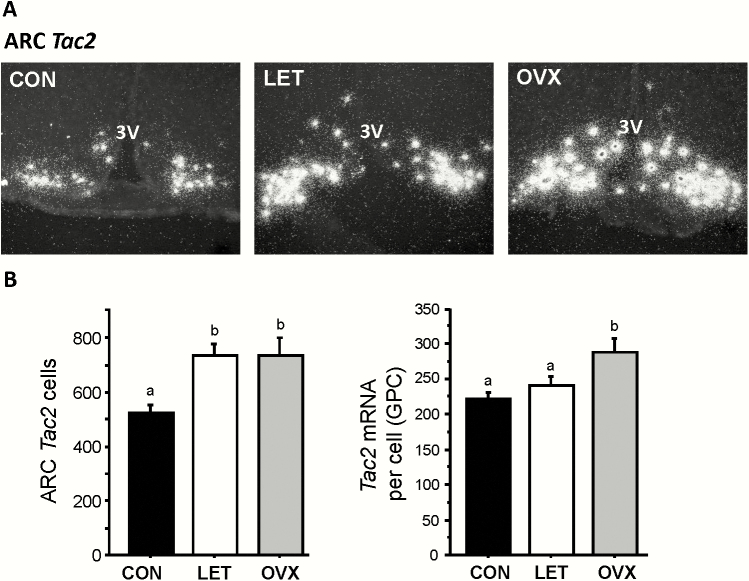
Figure 5.
Increased Tac2 expression levels in the arcuate nucleus of LET mice. A) Representative microscope image of Tac2 mRNA expression in the ARC nucleus, as determined by radiolabeled in situ hybridization. B) Mean Tac2 cell number and Tac2 mRNA per cell in the arcuate nucleus. Different letters above bars indicate significantly different from each other.

