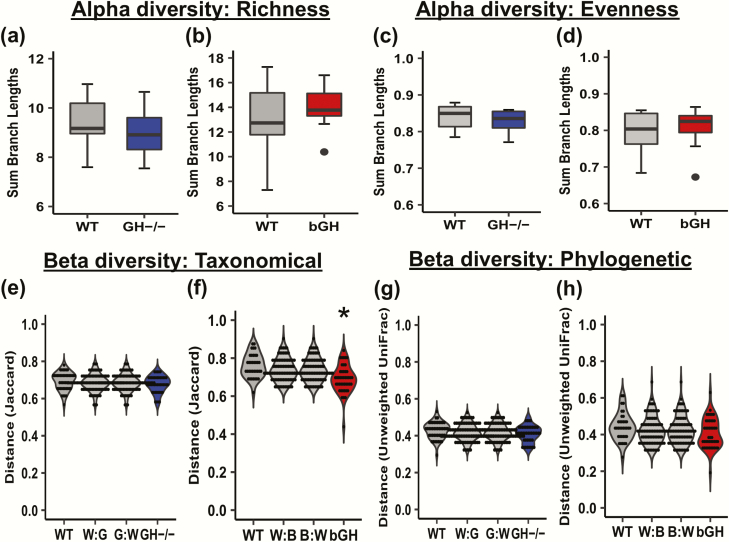
Figure 2.
Diversity in the GH-/- and bGH microbiome. A-D: Alpha diversity in GH-/- and bGH microbiome compared with respective littermate controls. Alpha diversity measures the richness (number of populations) and evenness (proportionality of the populations) in an individual mouse microbiome. A-B: Faith’s phylogenetic diversity. A. in GH-/- mice and littermate controls (Cohen d = 0.42). B. in bGH mice and controls (Cohen d = 0.32). C-D: Evenness alpha diversity. C. in the GH-/- mice and controls (Cohen d = 0.39). D. in bGH and control mice. (Cohen d = 0.30). E-H: Beta diversity in GH-/- and bGH microbiome compared with respective littermate controls. Beta diversity measures the microbial differences within and between groups on a distance matrix using a PCoA. E-F: Jaccard non-phylogenetic beta diversity measurements. E. GH-/- microbiome. F. bGH microbiome. *P = 0.025; determined by PERMANOVA with a post hoc Bonferroni test. G-H: Unweighted UniFrac phylogenetic diversity. G. GH-/- microbiome. H. bGH microbiome.

