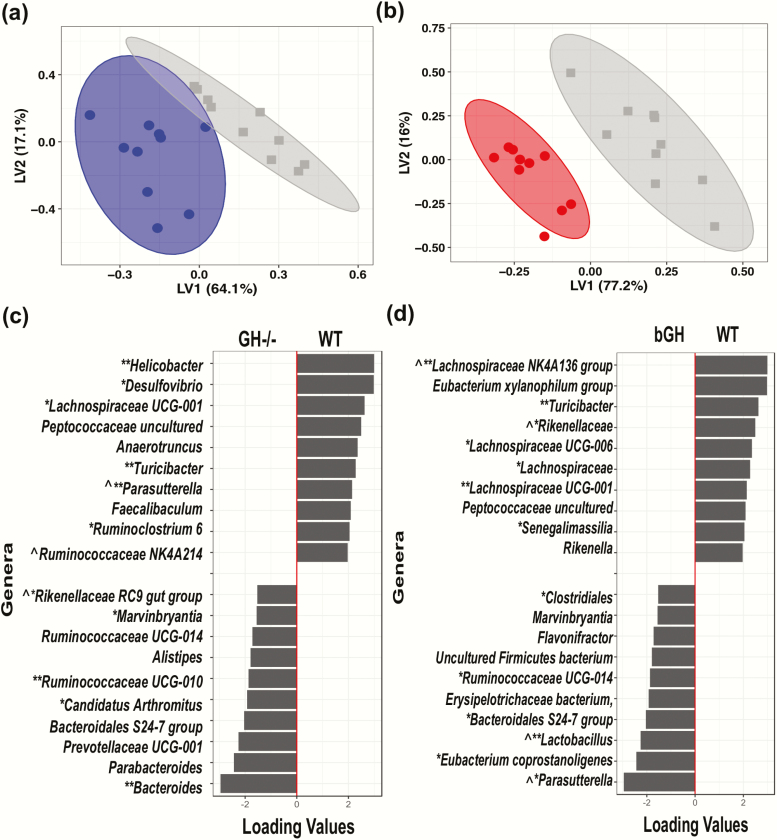
Figure 4.
Unique microbial signature in GH-/- and bGH microbiome determined by partial least squares-discriminant analysis (PLS-DA) at the genus level. A. Score plot of PLS-DA of GH-/- mice (blue) and controls (gray). B. Score plot of bGH mice (red) and controls (gray). C. Loading plot of the top 20 genera for GH-/- microbiome. Left column shows the top 10 genera increased in GH-/- mice while the right column represents the top 10 genera decreased in abundance in GH-/- mice. D. Loading plot for bGH microbiome. Left column shows the top 10 genera increased in abundance while the right column represents the top 10 genera decreased in abundance in bGH mice. *VIP bacteria; **Top 4 VIP genera in both mouse lines. ^Shared bacteria from PLS-DA and VIP analysis in present in GH-/- and bGH microbiomes in opposite directions.

