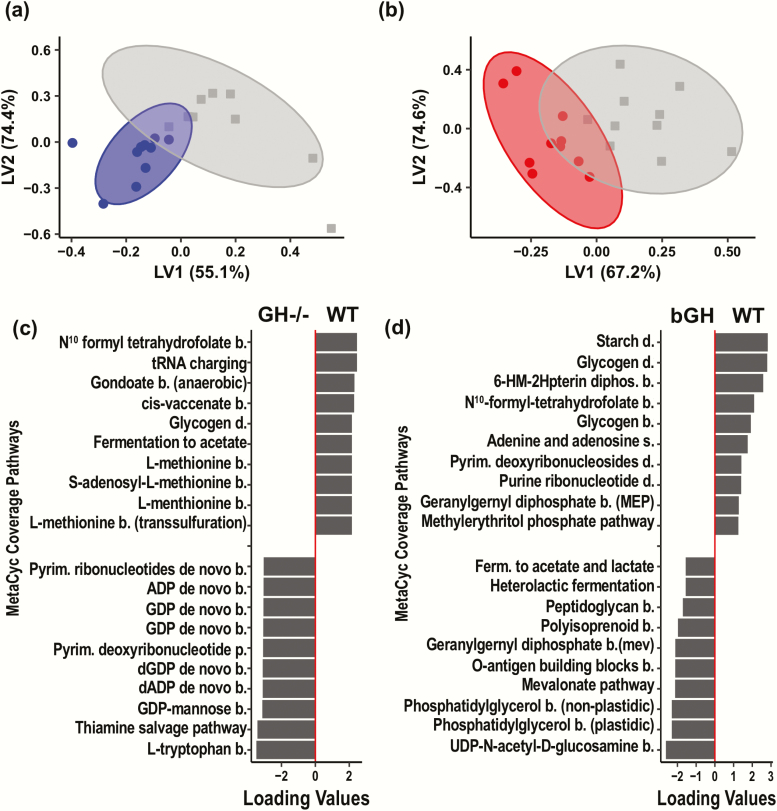
Figure 5.
Distinct predictive metabolic function in GH-/- (blue) and bGH microbiome (red) using partial least squares-discriminant analysis (PLS-DA). A-B: Score plots of the GH-/- mice and bGH mice compared with respective littermate controls based on the MetaCyc coverage pathways. A. Score plot of GH-/- mice and controls. A significant difference was seen between these groups. B. Score plot of the bGH mice and controls. A significant difference was seen between groups. C-D: Top 20 metabolic pathways associated with GH-/- microbiome and bGH microbiome. (Left: top 10 upregulated; right: top 10 downregulated with altered GH action mouse lines). C. GH-/- microbiome compared with controls. D. bGH microbiome compared with controls.

