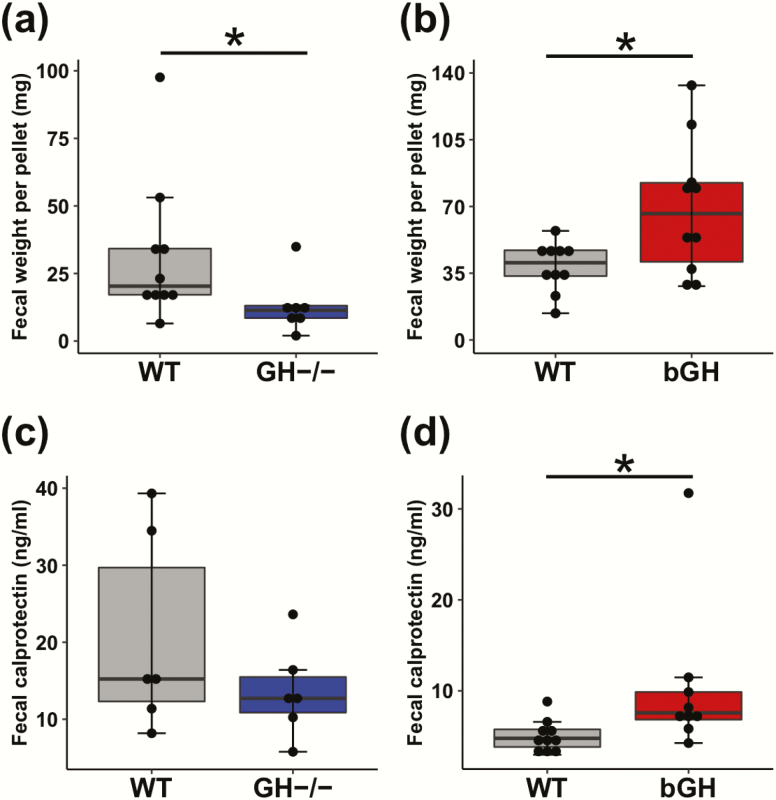
Figure 8.
Fecal output and intestinal inflammation in GH-/- (blue) and bGH mice (red) compared with littermate controls (gray). A-B. Fecal weight. A. in GH-/- mice and controls. *P = 0.033 (Cohen d = 0.92). B. in the bGH mice and controls. *P = 0.025 (Cohen d = 1.15). C-D. Fecal calprotectin levels. C. in GH-/- and control mice (Cohen d = 0.74). D. in bGH and control mice *P = 0.007 (Cohen d = 0.88).

