Fig. 3.
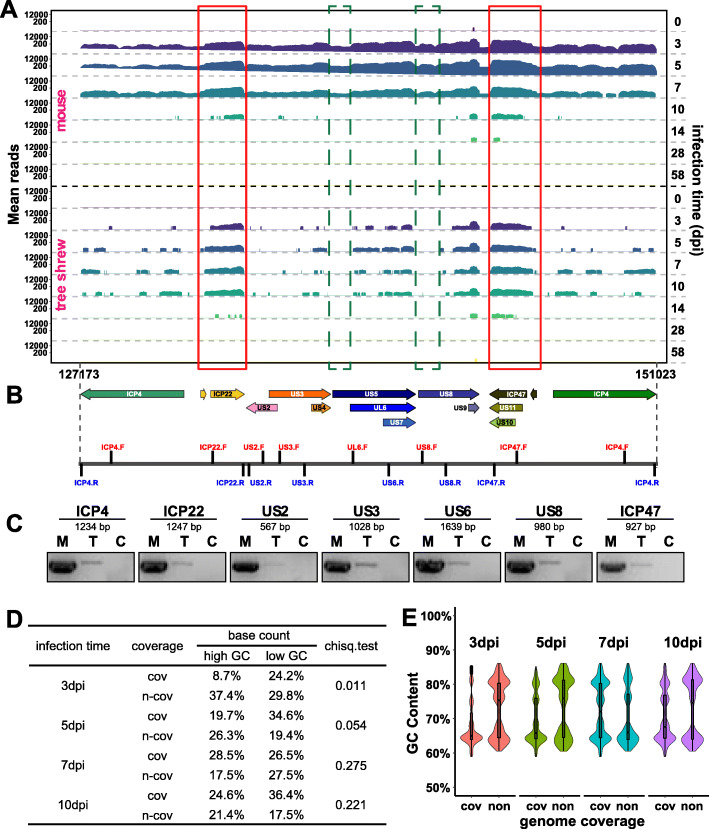
Characterization of ICP4 and other US transcripts. a Coverage profiles for ICP4 and serial US genes at indicated days post-infection are shown. Bedtools (v2.27.1) software and ‘genomecov’ arithmetic was used to compute the depth over the entire HSV-1 genome at each genome position. Respective transcription coordinates and chromosome regions are indicated at the bottom and infection time (dpi) are shown in the right. Data represents the average count from three biological replicates. Red box: both covered region in acute infected mouse and tree shrew samples; green box: uncovered region in acute infected tree shrew samples but in mouse samples. b Schematic view of PCR region of used primers. c PCR results of ICP4 and US genes of 5dpi TGs. M: mouse, T: tree shrew, C: blank control (ddH20 template). d Analysis of the effect of GC content on reads coverage in ICP4 and US genes region. Chose the range from 127,173 to 151,023 bp as the analysis region. Mean reads count <= 10 were seen as “non-coverage”, and mean reads count > 10 were considered as “coverage”. Select 1 kb as a window to calculate the GC content at each site, and GC contents > = 70% were regarded as high GC loci, and < 70% were regarded as low GC loci. The coverage and number of GC sites in each acutely infected tree shrew samples were counted, and the relationship of GC content and coverage was analyzed by Chi-square test using R software. Significant: chiseq.test <= 0.05; non-significant: chiseq.test > 0.05. e Violin plot showing the distribution of GC content and reads coverage statue in ICP4 and US genes region. Infected time (day): 3dpi, 5dpi, 7dpi and 10dpi; coverage statue: cov = coverage, non = non-coverage

