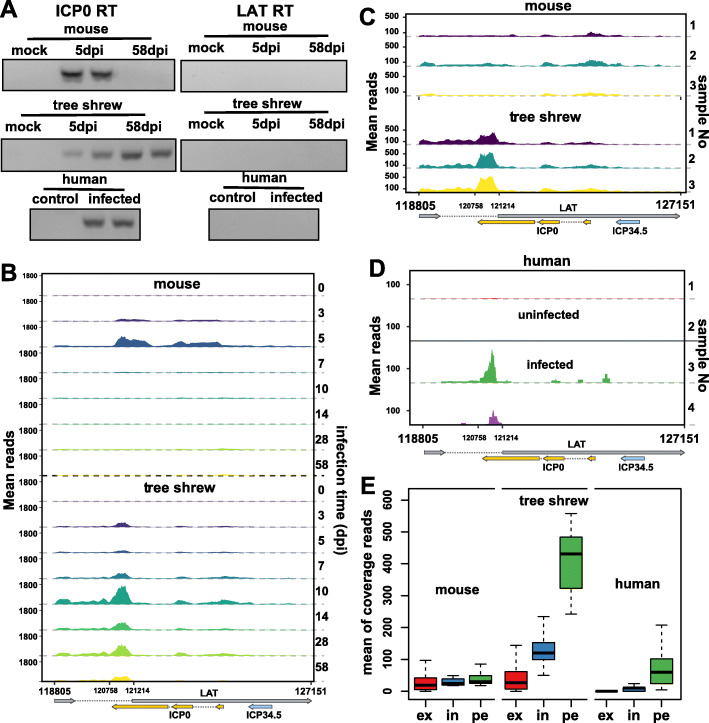
Fig. 5.
Comparison of LAT transcription patterns during latency between human and animal models. a Gel electrophoresis shows that an ICP0 fragment can be amplified in latent tree shrew and human samples, but not latent mouse samples. A strand specific primer was used for ICP0 reverse transcription. The primer sequence of RT primers and PCR primers were both listed in supplemental Table 2. b Coverage profiles for the LAT region at indicated days post-infection are shown. The mean reads were calculate using three biological replicates. c Showing the read coverage for LAT region of each 58dpi sample respectively and d for the human samples we collected (1#&2# uninfected samples; 3#&4# infected samples). e Box plots displaying the coverage distribution at three locations within LAT region. ex: LAT exon; in: LAT intron (remove peak region); pe: peak region (120,758-121,214 bp)

