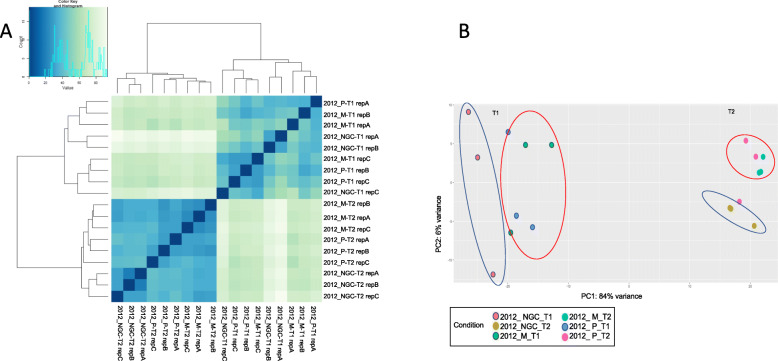
Fig. 1.
Panel a: Hierarchical cluster analysis (HCA) of all samples sequenced by RNA-seq. Heatmaps reporting clustering of all samples were generated upon rlog-transformation of DESeq2-normalized expression data. Color key scheme: X axis reports euclidean distances among samples, Y axis reports the number of times a color/value is represented in the graph. Panel b: Principal Component Analysis (PCA) of the samples sequenced by RNA-seq. X-axis represents first component, Y-axis the second component. Dots with the same color indicate same sample, different replicates. Blue ovals enclose NGC samples, red ovals enclose grafted samples. Sample names: M = Mgt 101–14; P = 1103 Paulsen; NGC = not grafted control; Replicate A, B, C. T1 = veraison; T2 = maturity. (PDF 264 kb)

