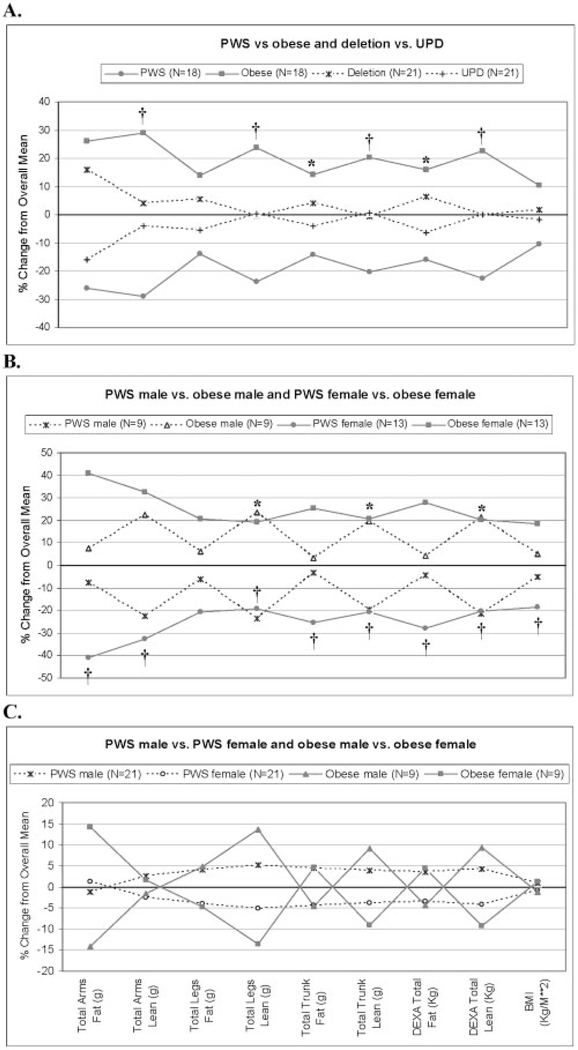
Figure 1:
(A) Percentage change from overall mean for fat and lean mass distribution variables between PWS and obese subjects and between PWS genetic subtypes matched for age and gender. N = 9 males and 9 females for both PWS and obese groups, and N = 9 males and 11 females for both PWS genetic subtypes. PWS mean age, 24.3 ± 11.3 years; obese mean age, 24.4 ± 11.9 years; PWS deletion mean age, 23.3 ± 8.1 years; PWS UPD mean age, 23.3 ± 9.3 years. The graph represents differences seen in regional and total body composition measures between matched obese and PWS subjects, with obese subjects having a higher percentage change from overall mean between the two groups for all measures compared with PWS individuals. Little to no difference in percentage change from overall mean was seen in PWS deletion or PWS UPD subjects. * p < 0.01. † p < 0.001 with Student’s t test. (B) Percentage change from overall mean for fat and lean mass distribution variables between PWS and obese males matched for age and between PWS and obese females matched for age. PWS males (N = 9), mean age, 21.8 ± 10.4 years; obese males (N = 9), mean age, 21.1 ± 10.1 years. PWS females (N = 13), mean age, 26.9 ± 7.9 years; obese females (N = 13), mean age, 27.1 ± 12.9 years. The graph represents differences seen in regional and total body composition measures between matched obese and PWS males and females, with obese females having a higher percentage change from overall mean for all measures compared with PWS females. However, only the lean measures showed higher percentage change in obese males compared with PWS males. * p < 0.01 with Student’s t test between PWS and obese males. † p < 0.001 with Student’s t test between PWS and obese females. (C) Percentage change from overall mean for fat and lean mass distribution variables between obese males and females matched for age and between male and female PWS subjects matched for age. Obese males (N = 9), mean age, 21.1 ± 10.1 years; obese females (N = 9), mean age, 21.1 ± 10.9 years. PWS males (N = 21), mean age, 23.8 ± 9.4 years; PWS females (N = 21), mean age, 23.1 ± 8.6 years. The graph represents little to no difference in body composition measures between matched PWS male and female subjects, whereas males in the obese group showed higher percentage change for lean measures, as expected, compared with obese females. This indicates that PWS males have a body composition pattern more similar to PWS females. No significant differences were found among the variables with Student’s t test.

