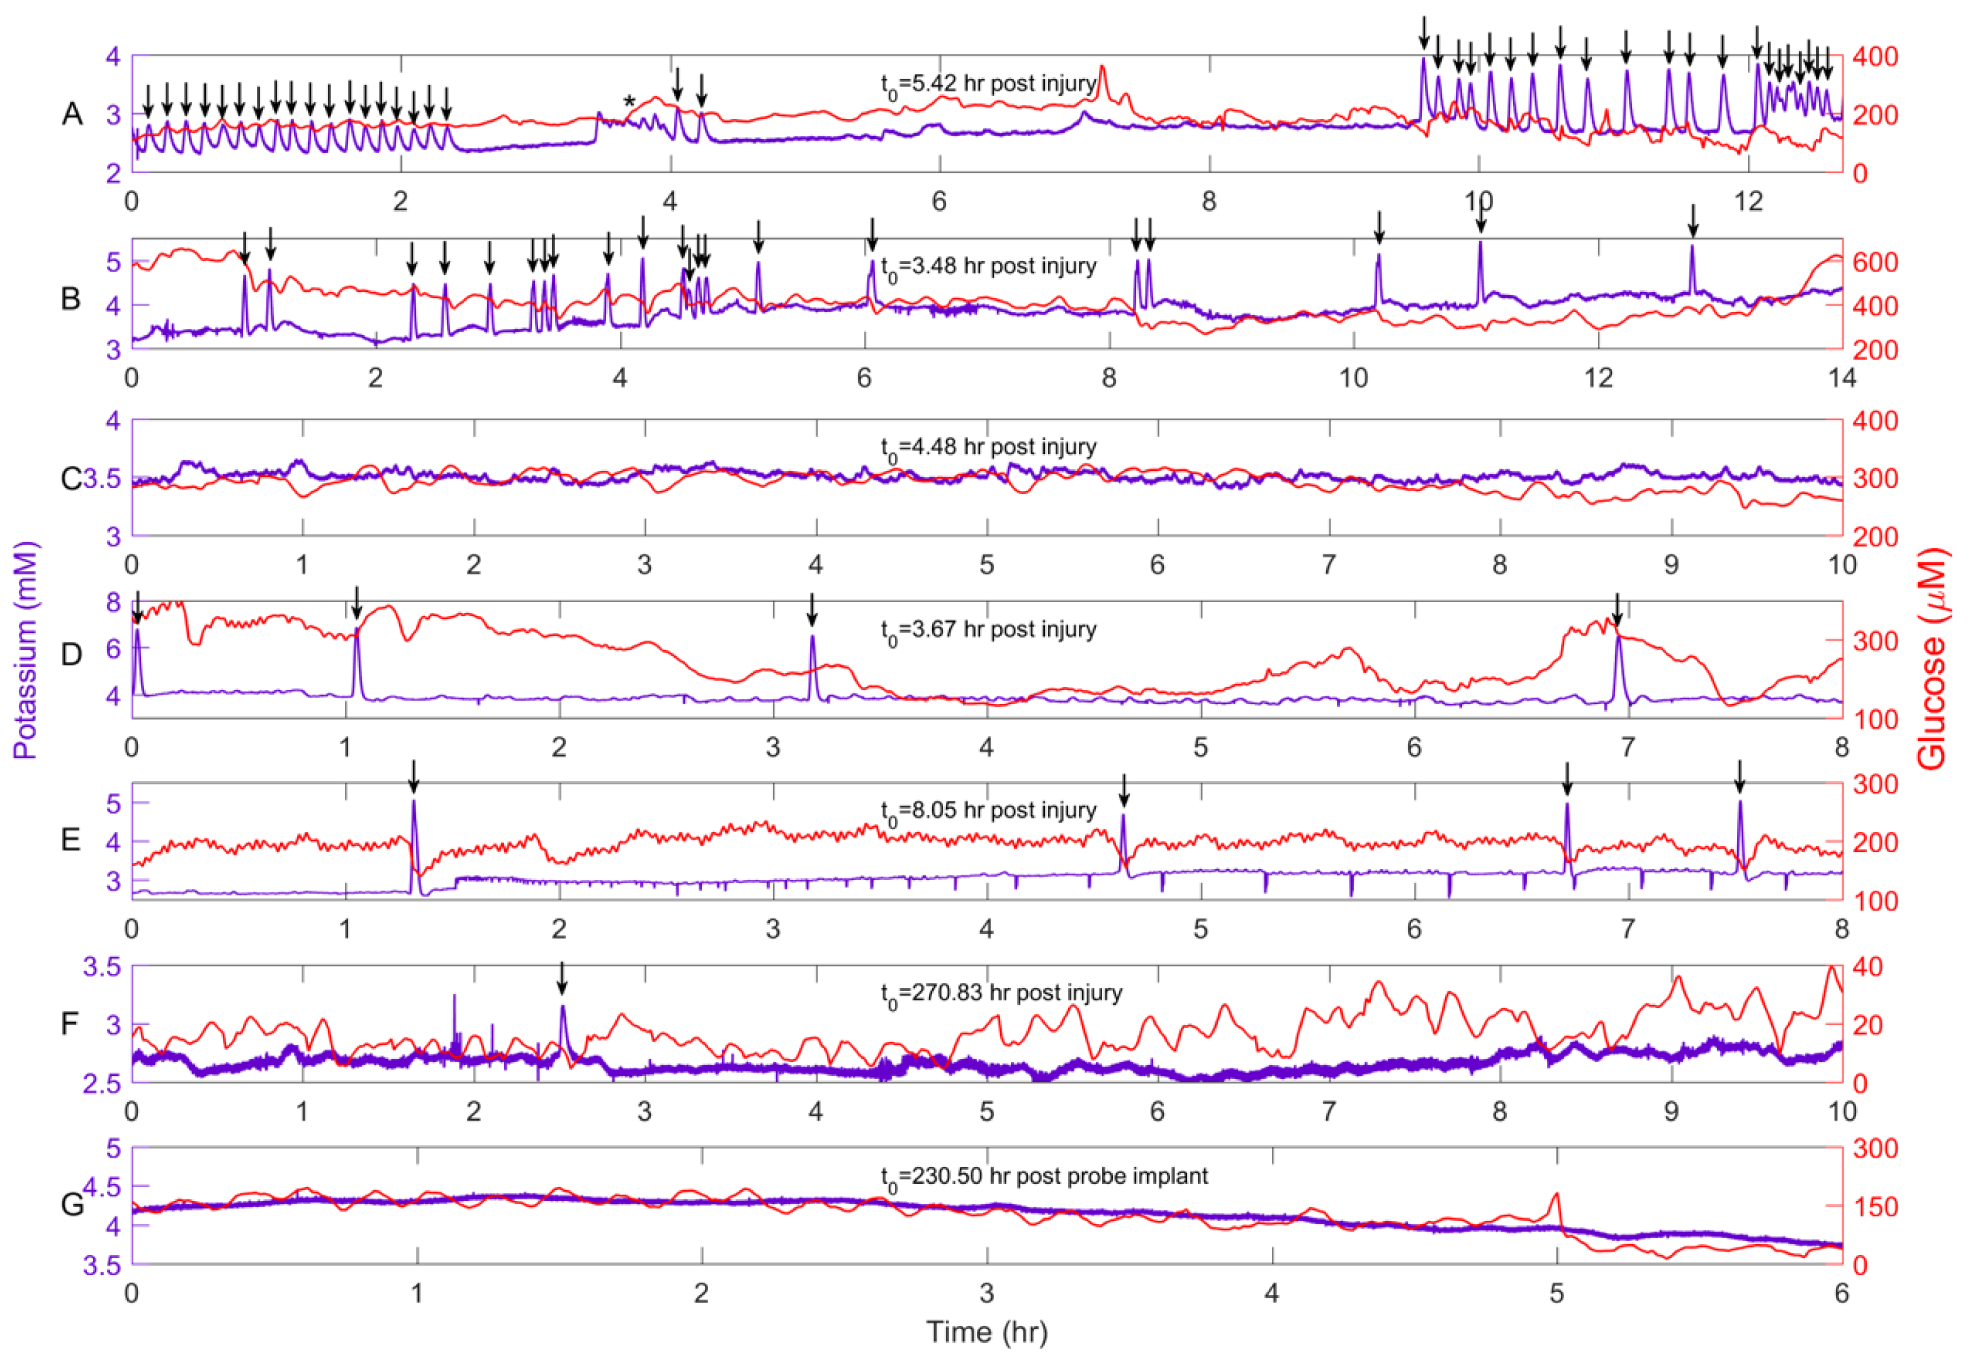
Figure 2.

Representative recordings of dialysate K+ (purple) and glucose (red) from seven different rats. The data in Panels A-E were collected within the first 24 hr after CCI and probe insertion. A and B) Rats 1 and 10 exhibited numerous SDs and SD clusters, some of which were accompanied by negative glucose transients. C) Rat 4 exhibited no SDs. D and E) Rats 2 and 6 exhibited isolated SDs. F) Rat 6 exhibited a spontaneous SD 12 days after CCI and probe insertion. G) CCI-naïve control rats do not exhibit spontaneous SDs. Arrows mark spontaneous SDs.
