Figure 3.
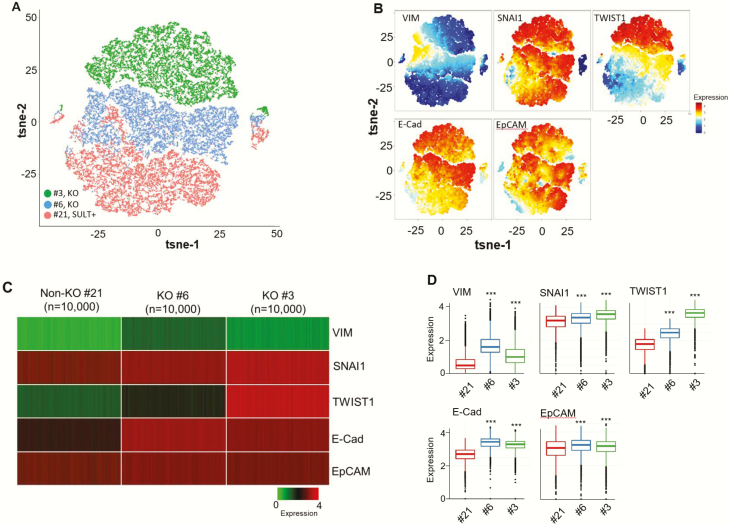
Single-cell mass cytometry of EMT-related proteins in SULT2B-KO and -non-KO C4-2 cells. (A) Visualization of clustered KO/non-KO clones from CyTOF data using t-SNE algorithm. (B) Levels of vimentin, SNAI1, TWIST1, E-cadherin and EpCAM in clustered KO (#3, #6) and non-KO (#21) cells. (C) Heatmaps of proteins queried in panel B for 10 000 randomly selected cells from each clone. (D) Box plots of mass cytometry data. Middle, top and bottom lines of each box signify median, 75th percentile, and 25th percentile of data, respectively. Black dots below or above the boxes are outliers. Protein levels in KO clones differed from the non-KO clone with high significance, showing P < .0001 for vimentin, SNAI1, TWIST1, and P < .001 for E-cadherin, EpCAM. Similar mass cytometry results were obtained with 2 different batches of cells.

