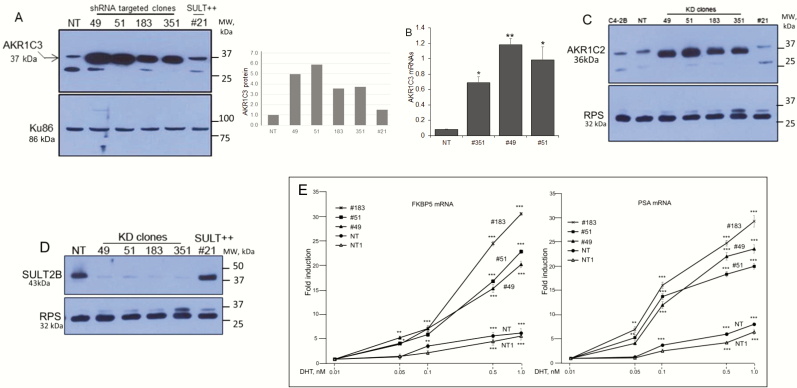
Figure 4.
Elevated AKR1C3, AKR1C2 expression and enhanced AR activity in SULT2B KD cells. (A) AKR1C3 in multiple clones of KD cells, nontargeted (NT) cells, and SULT2B-expressing CRISPR’d clone #21 cells. Panel at right shows quantified AKR1C3 signals in the Western blot. (B) AKR1C3 mRNAs in KD/non-KD cells. Data are from three biological replicates, assayed in duplicate. *P < .05; **P < .01. (C) AKR1C2 levels. D) SULT2B levels for clones analyzed in panels A, B and C. RPS (ribosomal protein S6, 32 kDa) is a control. (E) FKBP5 and PSA mRNA induction by DHT-activated AR. Induction is relative to the mRNA level at 0.01nM DHT (noninducing dose). NT and NT1 are independent stocks of the NT clone. Data shows average ± SEM from 3 biological replicates, assayed in duplicate by qRT-PCR and normalized to GAPDH and ubiquitin B mRNAs. Significance: *P < .05; **P < .01; ***P < .001.

