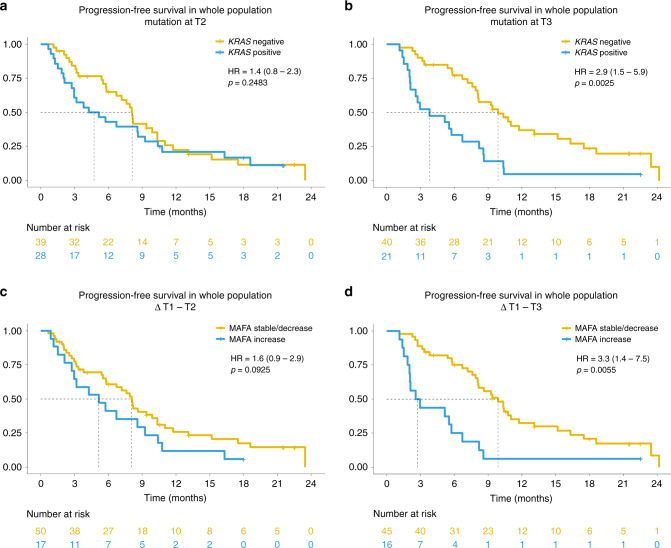
Fig. 1. Association of liquid biopsy results and progression-free survival (PFS).
Kaplan–Meier curves showing progression-free survival (PFS) of the overall study population according to the presence or the variation in mutated allele fractional abundance (MAFA) of KRAS mutation. The hazard ratios (HR) with 95% confidence interval (CI) and p values are also reported in the figure. a PFS according to the presence of KRAS mutation at T2; b PFS according to the presence of KRAS mutation at T3; c PFS according to MAFA variation from baseline (T1) to T2; d PFS according to MAFA variation from T1 to T3.

