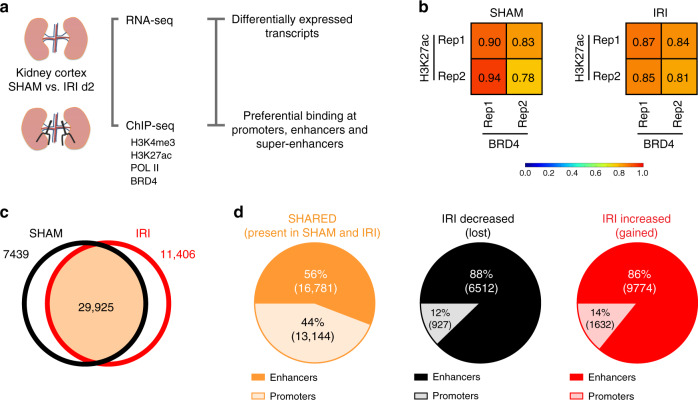
Fig. 1. Identification of enhancer elements.
a Workflow of the experimental approach. b H3K27ac marks and BRD4 binding sites strongly correlate in both SHAM and IRI samples. c Broad peak calling was applied on H3K27ac SHAM and IRI samples. 29,925 peaks overlapped between them; 7439 and 11,406 were only identified in SHAM or IRI samples, respectively. d 56% of the identified peaks SHARED between both samples are enhancer elements, whereas 44% are promoter elements. Peaks identified with preferential binding in SHAM samples (IRI-decreased) consist of 88% enhancers and 12% promoter regions. Out of 11,406 peaks identified with preferential binding in IRI samples (IRI-increased) 86% are enhancers and 14% are promoters.

