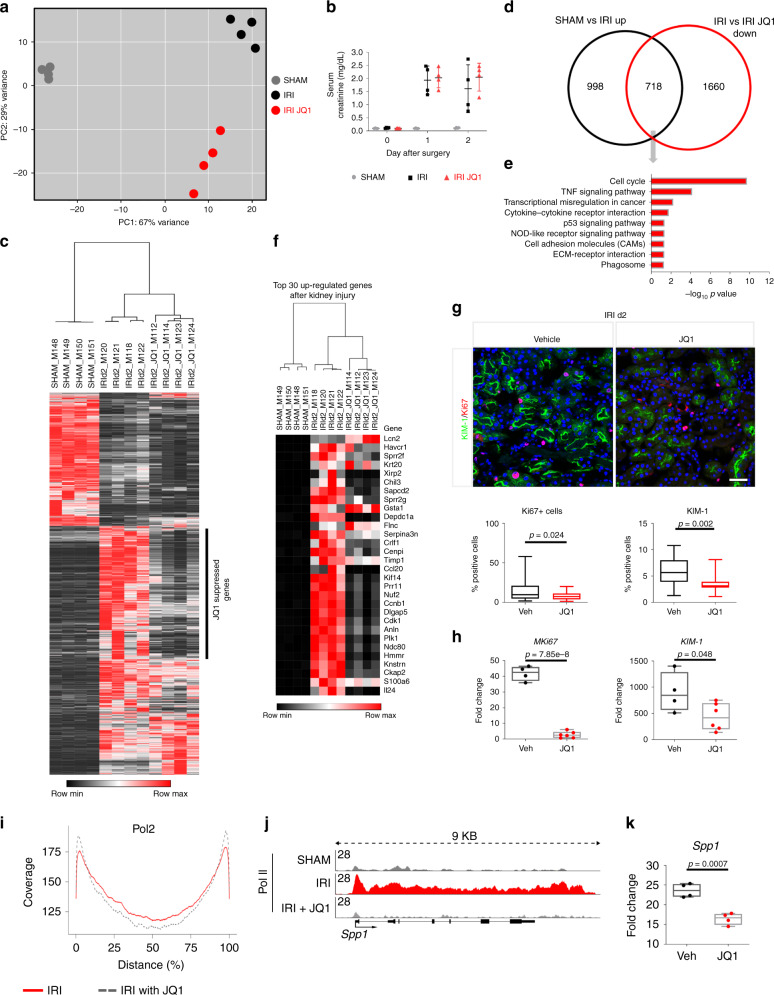
Fig. 6. Transcriptional consequences of sBET Inhibition.
a Principal component (PC) analysis of normalized RNA-seq data matrix of SHAM, IRI and IRI JQ1 kidney cortex samples on day 2 after IRI. b Serum creatinine values at days 0, 1, and 2 after IRI comparing SHAM, IRI and IRI JQ1-treated groups. c Genes significantly differentially regulated between SHAM and IRI are shown in a heatmap of SHAM, IRI, and IRI JQ1; JQ1 leads to suppression of ~40% upregulated genes after injury. d Comparison of significantly upregulated genes 2 days after injury (SHAM vs. IRI up) and significantly down-regulated genes after JQ1 treatment (IRI vs IRI JQ1 down) with an overlap of 718 transcripts (Chi-square test P < 0.001) shown in a Venn diagram. e KEGG pathways enriched for the 718 genes upregulated after injury and down-regulated by JQ1. f Top 30 upregulated genes after injury shown in a heatmap of SHAM, IRI and IRI JQ1 samples. g Representative KIM-1/Ki67-immunostained IRI kidney cortex treated with vehicle or JQ1 at day 2 after injury, Quantification of Ki67+ cells (Ki67+ cells/total number of cells (DAPI)) and KIM-1+ surface area per hpf (n = 4, 7 high power fields (hpf) per sample). Scale bar: 50 μm. h Fold change of Mki67 and KIM-1 after IRI comparing vehicle and JQ1 treated animals at day 2 after injury (vehicle: n = 4, JQ1: n = 6). i Genome-wide assessment of Pol II binding: Genome-wide coverage blots of Pol II on the gene body. Pol II binding after JQ1 treatment is increased at the TSS and decreased across the gene body indicating Pol II pausing j Pol II ChIP-seq tracks at the Spp1 gene body. k Fold change of Spp1 after IRI comparing vehicle and JQ1 treated animals at day 2 after injury. n = 4. Data represent the mean ± min, max. Box contains 50% of the data. t-test (two-sided) (g, h, k). Source data are provided as a Source data file.

