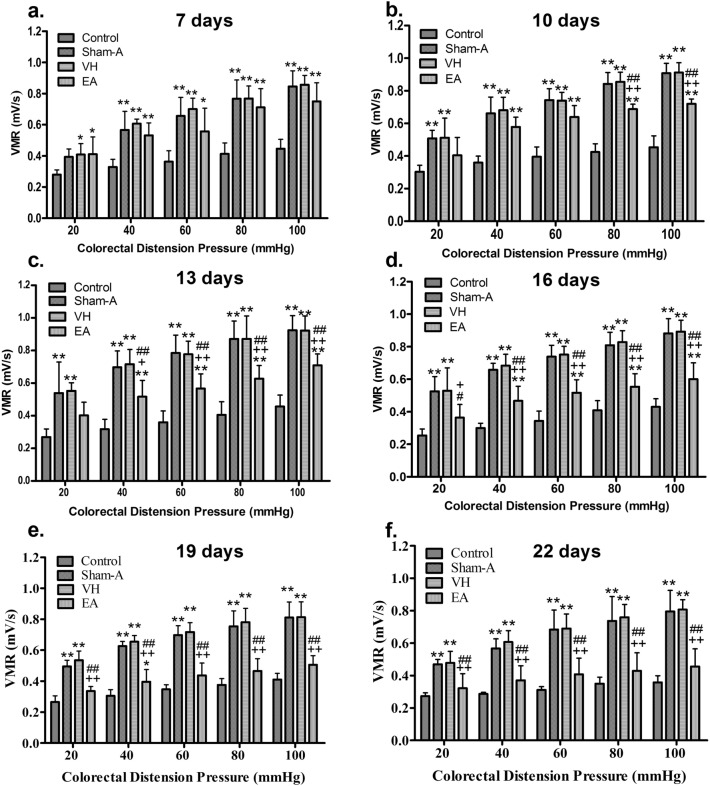
Figure 3.
Effects of EA treatments on visceral hypersensitivity, measured by electromyography (EMG) of abdominal muscles’ visceromotor responses (VMR) to colorectal distension pressure (CRD) (Mean ± SD, n = 6). The EMG and mechanical irritation signals were quantified using the MedLab U/4C501 software (Nanjing Medease Science and Technology Co., Ltd, China, https://www.medease.com.cn). EMG activities during distensions minus resting activities were considered as VMRs to CRD, and are expressed as millivoltage per-second (mV/s). The VMRs were increased with higher CRD pressures (a–f). VH or EA group versus Control group (P < 0.05; ANOVA P = 0.016) on day 7; Sham-A or VH or EA group (P < 0.01, 0.05) versus Control group with 40–100 mmHg (ANOVA P = 0.000) at days 7–22; Sham-A or VH group (P < 0.01) versus Control group with 20 mmHg on day 10 (ANOVA P = 0.001) and 13–22 (ANOVA P = 0.000).; Sham-A or VH group (P < 0.01) versus EA group with 80–100 mmHg (ANOVA P = 0.000) on day 10; Sham-A or VH group versus EA group (P < 0.01, 0.05) with 40–100 mmHg (ANOVA P = 0.000) on day 13; Sham-A or VH group versus EA group (P < 0.01, 0.01) with 20–100 mmHg at days 16–22. **P < 0.01, *P < 0.05, VH/ Sham-A/EA group versus Control group. ++P < 0.01 and +P < 0.05, Sham-A group versus EA group; ##P < 0.01, #P < 0.05, VH group versus EA group. One-way ANOVA followed by Bonferroni’s post-hoc test.

