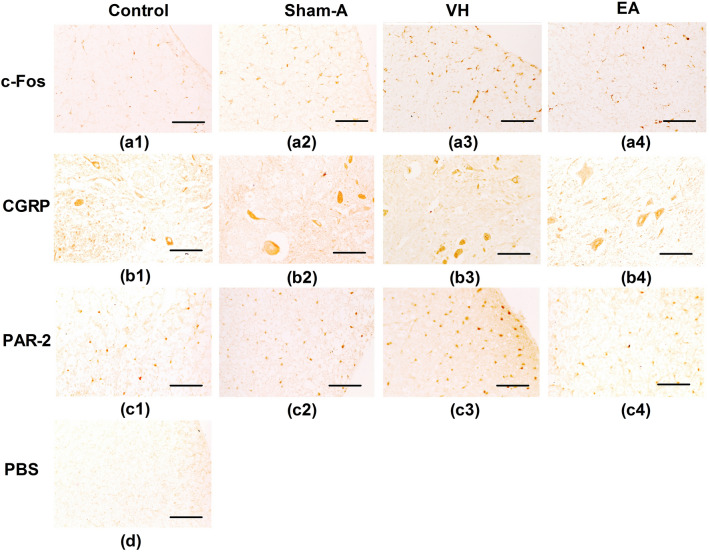
Figure 4.
Distribution of PAR-2, CGRP and c-Fos proteins (20 ×) in the spinal cord of the goats on day 22 (n = 6). c-Fos positive neurons in the dorsal horn of spinal cord of Control (a1), Sham-A (a2), VH (a3) and EA group (a4). CGRP positive neurons (browns) in the dorsal horn of the spinal cord of Control (b1), Sham-A (b2), VH (b3) and EA group (b4). PAR-2 positive neurons (browns) in the dorsal horn of spinal cord of Control (c1), Sham-A (c2), VH (c3) and EA group (c4). Dorsal horn of spinal cord of PBS (d). Brown stain shows the nuclei of positive cells or cytoplasm. Scale bars = 50 µm.

