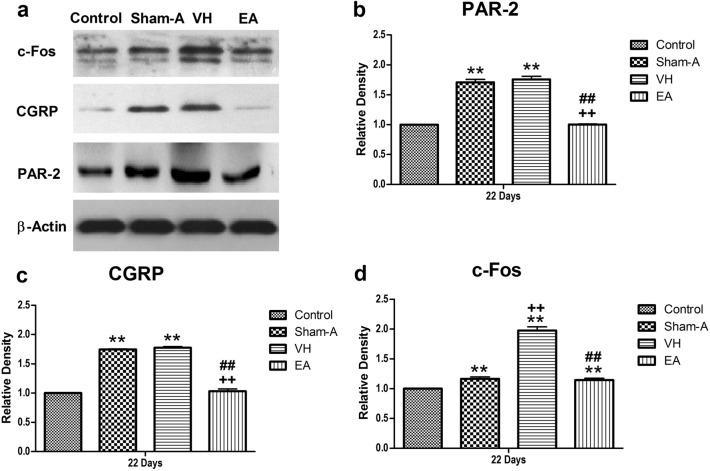
Figure 5.
Cumulative effects of repetitive EA treatments on the expression of PAR-2, CGRP and c-Fos in the spinal cord of the goats. (a) Western blotting of PAR-2, CGRP and c-Fos in the spinal cord of the goats. All electrophoresis was performed under the same condition. The immuno-detected protein bands, appeared on a horseradish peroxidase substrate (Millipore, Billerica, MA, USA), were visualized using the ImageQuant LAS 4,000 min CCD camera (GE Healthcare, Piscataway Township, NJ, USA). The bands were analysed using a Quantity One software (Bio-Rad), and the result is expressed as the immunoreactivity ratio of the target gene to β-actin. Insets show a representative band of the proteins expressed in all groups. Full-length blots are presented in Supplementary Fig. S1. Data were normalized against β-actin and expressed as the mean ± SD, n = 6. Semi-quantitative analysis of (b) PAR-2 expressions; P = 0.000, VH/Sham-A group versus Control group; P = 0.000, VH group versus Sham-A group; P = 0.000, VH group versus EA group [F (3, 20) = 1,040.60, P = 0.000]. (c) CGRP expressions; P = 0.000, VH/Sham-A group versus Control group; P = 0.000, VH group versus Sham A group; P = 0.000, VH group versus EA group [F (3, 20) = 1819.47, P = 0.000]. (d) c-Fos expressions; P = 0.000, Sham-A or VH or EA group versus Control group; P = .000, VH group versus Sham-A group; P = 0.000, EA group versus VH group [F (3, 20) = 223.53, P = 0.000]. **P < 0.01, VH/Sham-A/EA group versus Control group; ++P < 0.01, VH/EA group versus Sham-A group; ##P < 0.01, VH group versus EA group. One-way ANOVA followed by Bonferroni’s post-hoc test.

