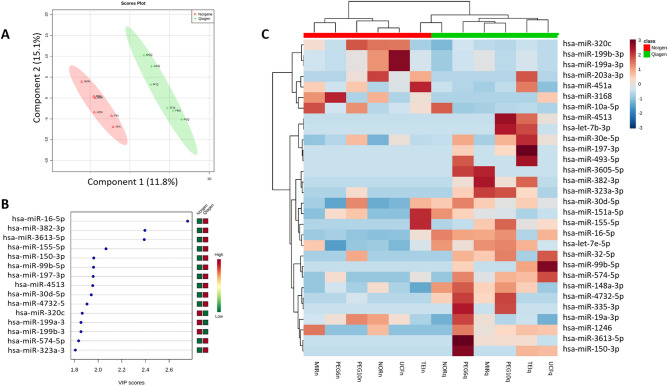
Figure 3.
Analysis of miRNAs by RNA isolation kit. (A) Multivariate analysis: PLS-DA of miRNAs according to the RNA isolation kit used. Red triangles and green crosses represent samples isolated with Norgene and miRNeasy (Qiagen), respectively. Class membership was represented by a 95% confidence ellipses calculated from PLS-DA scores. (B) Variable Importance in Projection (VIP) of the top 15 miRNAs, which represents the relative contribution of miRNAs to the variance between the two RNA isolation kits. The higher the VIP score, the better the contribution of the miRNA to the group separation. The green and red boxes on the right indicate whether the miRNA expression is increased (red) or decreased (green) on each group. (C) Heatmap of the 30 top miRNAs in the PLS-DA. Columns represent each sample, while rows correspond to miRNAs. The miRNA clustering tree is shown on the left, and the sample clustering tree is shown at the top. A higher presence of miRNAs is represented by red squares and lower presence by blue squares.

