
Figure 5.
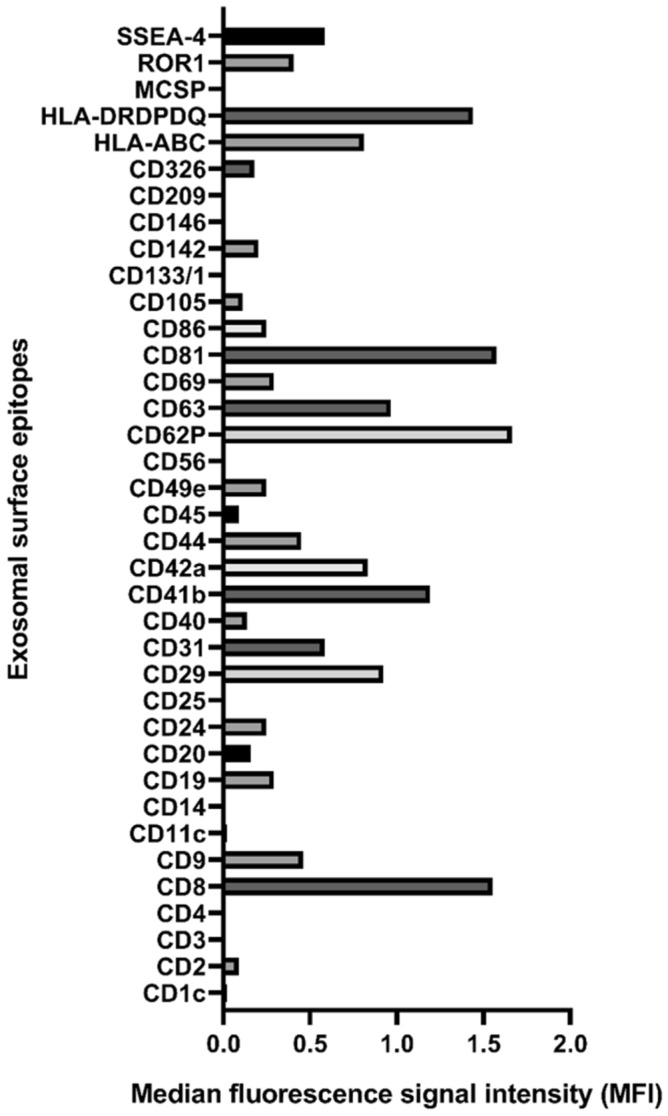
Surface markers of exosomes from a pooled plasma of HIV/HCV coinfected patients. Each bar corresponds to each exosomal surface epitope measured. X-axis indicates the median fluorescence signal intensity (MFI).
Official websites use .gov
A
.gov website belongs to an official
government organization in the United States.
Secure .gov websites use HTTPS
A lock (
) or https:// means you've safely
connected to the .gov website. Share sensitive
information only on official, secure websites.
Surface markers of exosomes from a pooled plasma of HIV/HCV coinfected patients. Each bar corresponds to each exosomal surface epitope measured. X-axis indicates the median fluorescence signal intensity (MFI).