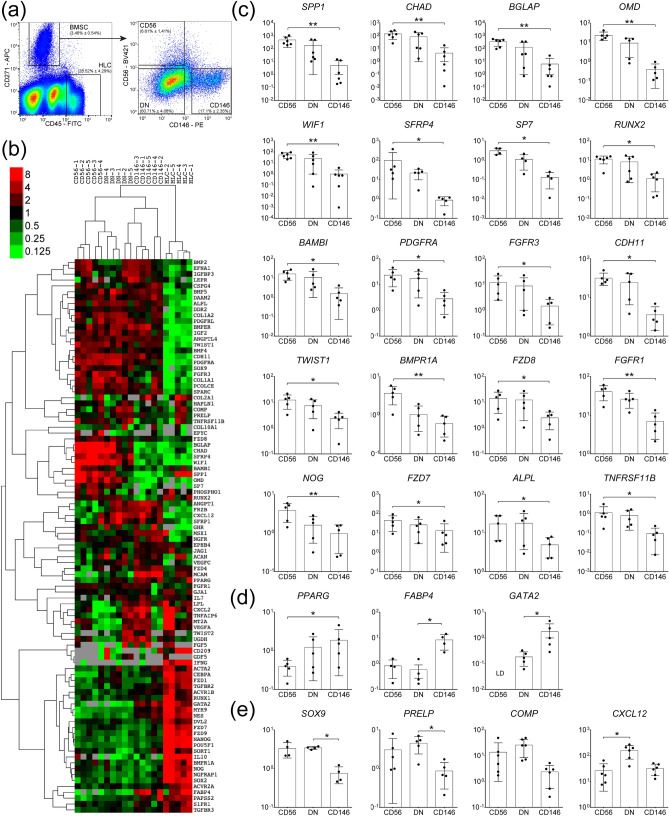
Figure 1.
Gene expression profile of CD56+ BMSC subset in OA femoral head trabecular bone. (a) Cell sorting strategy based on the identification of CD45-CD271+ BMSCs and negative control CD45+CD271- HLCs followed by the separation of BMSCs into the three distinct subsets: CD56+ (CD45-CD271+CD56+), CD146+ (CD45-CD271+CD146+) and DN (CD45-CD271+CD56-CD146-) (proportion of each subpopulation is presented as mean ± SD, n = 23 donors). (b) Dendrogram showing hierarchical cluster analysis of the BMSCs subsets and HLCs gene expression from OA trabecular bone; the colour scale reflects the log transformed fold differences relative to HPRT1; grey—missing data (below detection). (c) Osteogenesis-related genes expressed at significantly higher levels in CD56+ subset compared to CD146+ subset. (d) Genes expressed at lower levels in CD56+ subset compared to CD146+ subset. (e) Chondrogenesis associated genes and CXCL12. Data are represented as bar graphs (means) with standard deviations (error bars) for donor-matched samples and gene expression values are relative to HPRT1 on a log scale. LD: low detection; * < 0.05, ** < 0.01, Friedman test for the donor matched samples corrected with the Bonferroni–Dunn multiple-group comparison. While n = 6 donor samples were analysed, only n = 5 had complete datasets for all the sorted subsets to be presented in the dendrogram (b). However, where present the genes with 6 matching data points are shown for full transparency of acquired data (c–e).

