Figure 3.
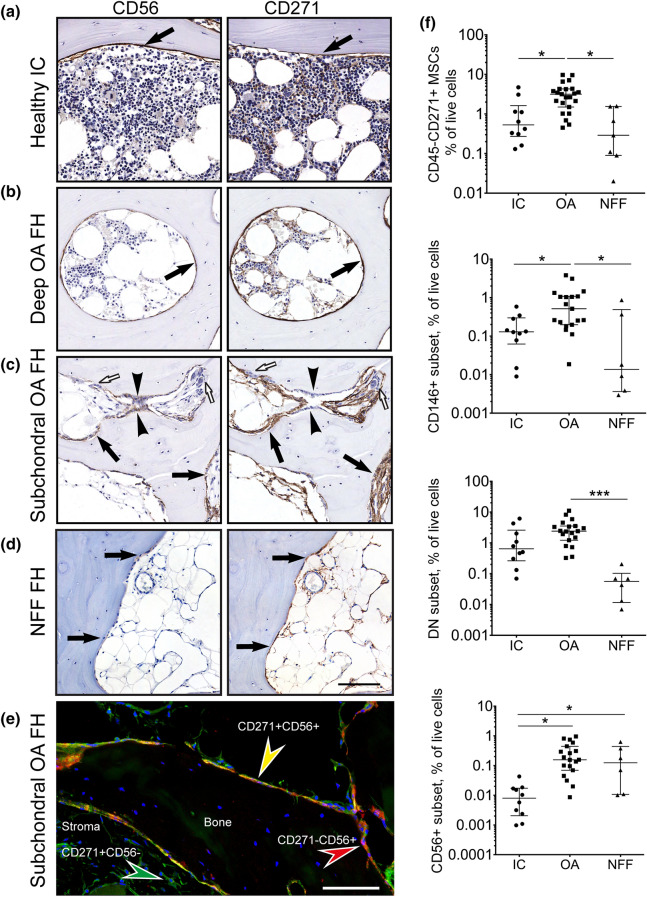
The topography (a–e) and quantification (f) of CD271+CD56+ BMSC subset in osteoarthritic and control trabecular bone. Representative adjacent sections (5 μm) stained with antibodies against CD56 and CD271. (a) Heathy iliac crest, (b) Deep area of trabecular bone in OA femoral head, (c) subchondral area with active bone remodelling area of OA femoral head and (d) subchondral area of NFF femoral head. Arrows: bone lining location of CD56+ and CD271+ cells, arrow heads: osteoblasts, white arrows: osteoclasts. Scale bar 100 μm. (e) immunofluorescence double-staining of subchondral area of OA femoral head for CD271 (green) and CD56 (red) indicating their co-expression on the cells at the bone surface (yellow); blue: nuclear staining using DAPI; Scale bar 50 μm. (f) Quantification of native CD45-CD271+ BMSCs extracted from trabecular bone of OA donors (N = 23) in comparison to healthy IC (N = 11) and NFF (N = 6) trabecular bone. Graphs presented as dot plots show the percentages of CD45-CD271+ BMSCs in total live cells as well as the percentages of each of the CD271+ BMSC subset in total live cells. Each dot represents one donor. * < 0.05, *** < 0.001, Kruskal–Wallis test.

