Figure 4.
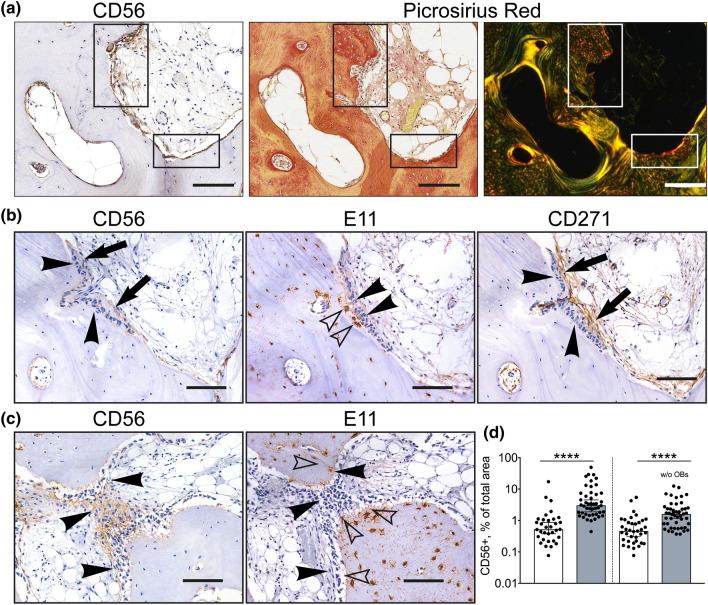
CD56+ subset involvement in new bone formation in OA. (a) Co-localisation of CD56+ cells (left panel) with the areas of new bone formation indicated by picrosirius red staining visualised under bright field microscopy (middle panel) and polarised light microscopy (right panel); rectangles: areas of interest for CD56+ cells activity. (b) and (c) Representative adjacent sections from the areas of bone sclerosis. Co-localisation of CD56+ cells (left panel) with immature E11+ osteocytes (middle panel) in comparison to the whole population of CD271+ BMSCs (right panel); (b) sagittal section, (c) transverse section (through growing trabeculae). (d) Graph showing the area of CD56 positivity as percentage of total cavity area (multiple measurements from n = 4 femoral heads). White box: non-sclerotic areas of femoral heads; grey box: sclerotic areas; w/o OBs: without osteoblasts. **** < 0.0001, Kruskal–Wallis test. Arrows: bone lining location of CD56+ and CD271+ cells, arrowheads: osteoblasts, empty arrowheads: E11+ osteocytes. Scale bars 100 μm.

