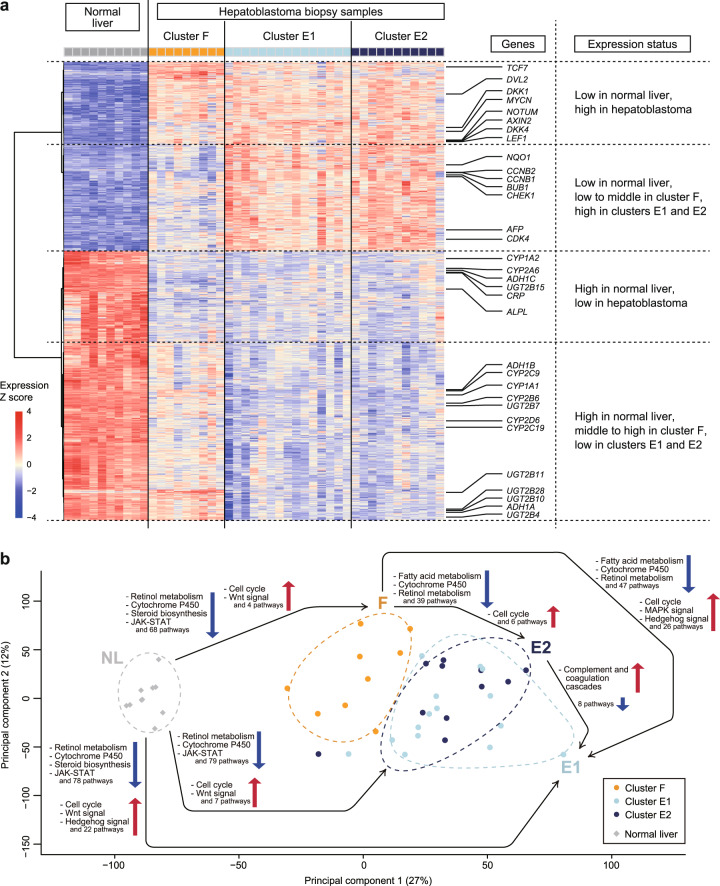
Fig. 3. Gene expression analysis of hepatoblastoma and normal liver (NL) reveals similarity between the hepatoblastoma clusters E1 and E2 as well as a relative proximity of cluster F to the NL.
a Heatmap of the expression data of 2000 differentially expressed genes among four clusters (NL and three hepatoblastoma clusters F, E1, and E2; Supplementary Data S8) across 35 hepatoblastoma biopsy samples and ten NL samples. The expression level is log-transformed and z-normalized to zero mean and unit standard deviation for each gene. b Principal component analysis plot for the expression data. Summarized results of the pathway analysis of differential expression among the hepatoblastoma and NL clusters are added on the plot; a black arrow directed from cluster X to Y and pathway A described nearby with an upward/downward arrow indicates significant upregulation/downregulation of pathway A in cluster Y compared with cluster X.

