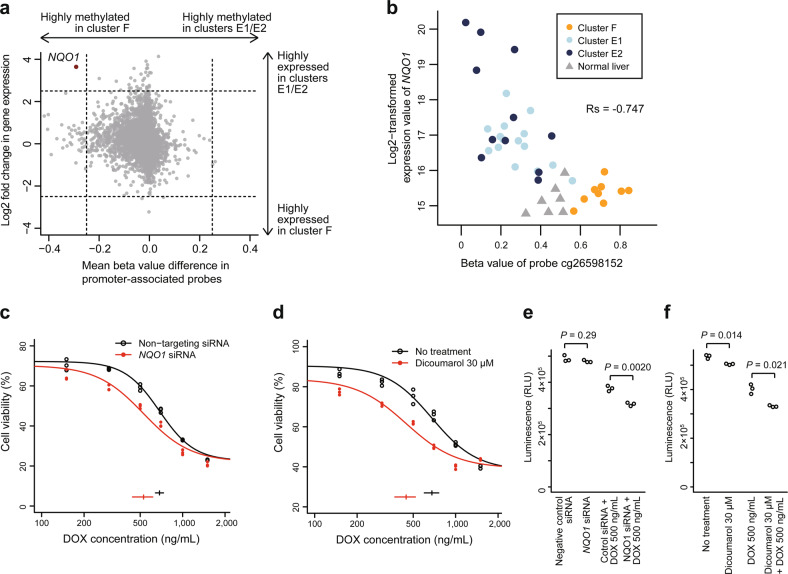
Fig. 4. High expression of NQO1 based on promoter hypomethylation is a characteristic of high-risk hepatoblastoma and a potential therapeutic target for chemoresistance.
a Starburst plot showing the correlation of differences in promoter methylation and expression between the hepatoblastoma clusters F versus E1/E2. The only gene with absolute methylation difference ≥ 0.25 and absolute log2-fold expression change ≥ 2.5 is NQO1, indicated in red. b Correlation between the methylation of probe cg26598152 and NQO1 expression. Rs represents Spearman’s correlation coefficient. c, d Dose–response curves of HepG2 cells exposed to various concentrations of doxorubicin (DOX) after NQO1 inhibition (red) or negative control treatment (black). NQO1 was inhibited by using siRNA (c) or dicoumarol (d). Horizontal bars and whiskers at the bottom indicate EC50 values with 95% confidence intervals. e, f Enhancement of DOX cytotoxicity by NQO1 inhibition in HepG2 cells. NQO1 was inhibited using siRNA (e) or dicoumarol (f). The luminescence intensities representing the cell viability are compared between the conditions with and without NQO1 inhibition using the unpaired Student’s t test.

