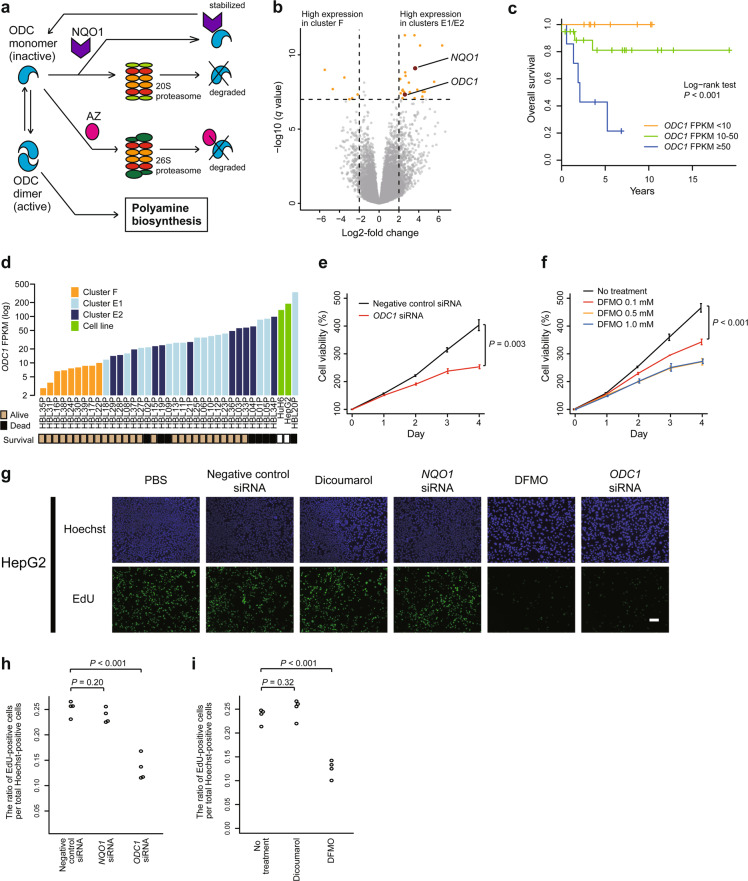
Fig. 5. ODC1 is differentially overexpressed in high-risk hepatoblastoma and a key molecule for rapid cell proliferation in hepatoblastoma.
a Schematic presentation of ODC1 stabilization by NQO1. b Volcano plot displaying genes that are differentially expressed between the hepatoblastoma clusters F versus E1/E2. Each gene is plotted with log2-fold expression change on x-axis and negative log10 false discovery rate (FDR) q value on y-axis. Genes with absolute log2-fold change > 2 and an FDR q value of <1.0 × 10⁻⁷ are shown in orange. NQO1 and ODC1 are shown in red. c Kaplan–Meier survival curves for overall survival according to ODC1 expression. d ODC1 FPKM in hepatoblastoma samples and cell lines. e, f Cell proliferation assay to assess the effect of ODC1 inhibition on HepG2 cells. ODC1 was inhibited using siRNA (e) or difluoromethylornithine (DFMO; f). Error bars indicate SD of triplicate experiments. Cell viabilities on day 4 are compared between the conditions using the unpaired Student’s t test. g–i Ethynyl deoxyuridine (EdU) assay using HepG2 cells treated with PBS, dicoumarol, DFMO, and negative control/NQO1/ODC1 siRNA. The ratio of EdU-positive cells per total Hoechst-positive cells are compared among the conditions using the unpaired Student’s t test. Scale bar represents 100 μm.

