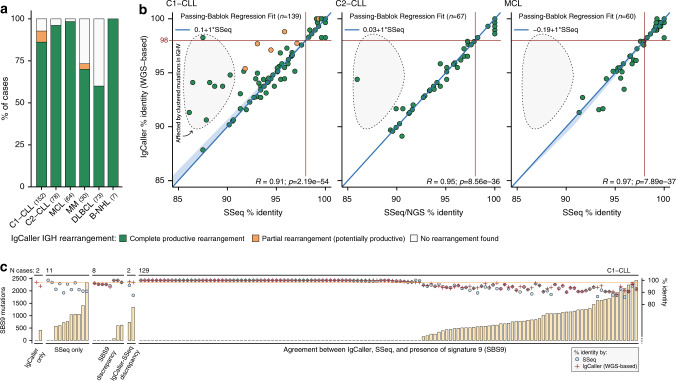
Fig. 2. Benchmarking of IgCaller: characterization of the IGH locus.
a Bar plot showing the percentage of cases with productive IGH rearrangements by IgCaller in each cohort. b Dot plots of the percentage of identity of the rearranged IGHV sequence to the germ line by IgCaller (y axis) and SSeq/NGS (x axis). The 95% confidence interval is depicted by the light blue area. The gray area highlights cases in which the presence of a high density of clustered mutations impairs an accurate identification of the percentage of identity. P values are from t-test. c Comparison of the number of mutations associated with signature 9 (SBS9, left y axis) and the identity of the rearranged sequence both by SSeq and IgCaller (right y axis) in the C1-CLL cohort. Source data are provided as a Source data file.

