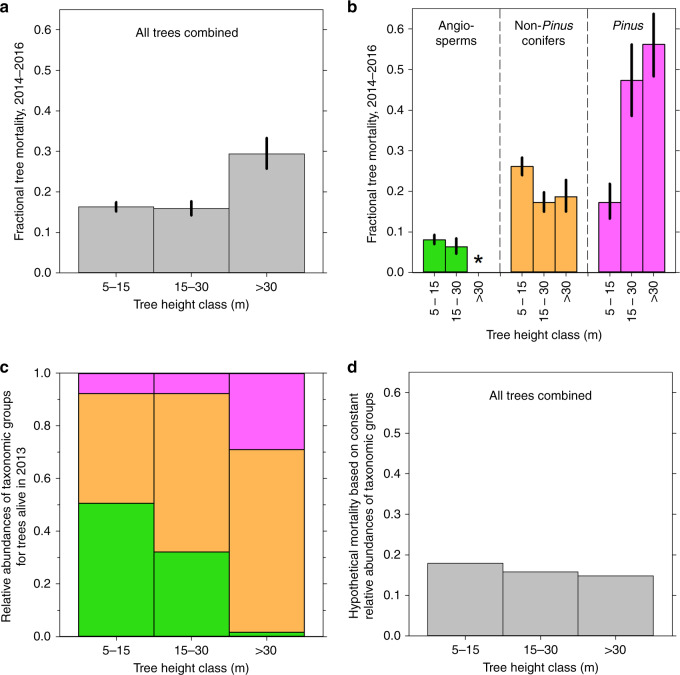
Fig. 1. Tree mortality and relative abundances of taxonomic groups by height class during the extreme drought.
a 2014–2016 mortality by height class, all trees combined. Bar heights show mean mortality (with 95% credible intervals) derived from the posterior distributions of parameters estimated from 45,000 Markov Chain Monte Carlo iterations (three 15,000-iteration chains), as described in Methods. b 2014–2016 mortality by height class for each taxonomic group (bar heights and credible intervals are as in a). None of the 9 angiosperms >30 m tall died, yielding 0 mortality; for reference, the asterisk indicates mortality for a larger sample (the 71 angiosperms >25 m tall). Numbers of sampled trees contributing to the other combinations of taxonomic group and height class are given in Supplementary Table 6 and Supplementary Fig. 3. c Relative abundances of the taxonomic groups within each height class, for trees alive in 2013 (green = angiosperms; orange = non-Pinus conifers; magenta = Pinus). d Hypothetical 2014–2016 mortality for all trees combined, calculated using actual height- and taxa-specific mortality values but assuming constant relative abundances of taxonomic groups across height classes (Supplementary Table 4). Because these results are hypothetical, no credible intervals are shown.

