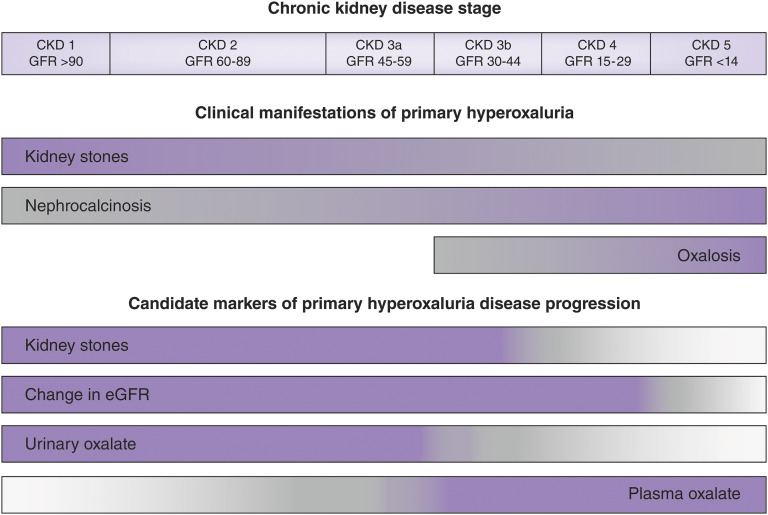
Figure 1.
Clinical manifestations observed in primary hyperoxaluria and candidate markers of progression vary by kidney disease stage. The consequences of hepatic oxalate overproduction (upper bars) are shaded to reflect high (purple) to low (gray) relative frequency, as best is known at this time. The clinical and biochemical markers (lower bars) are shaded to indicate those supported by clinical and experimental evidence (purple), while those with insufficient data and need for further research are shaded lighter (gray). Figure modified from the original provided courtesy of S. Hulton.

