
Figure 3.
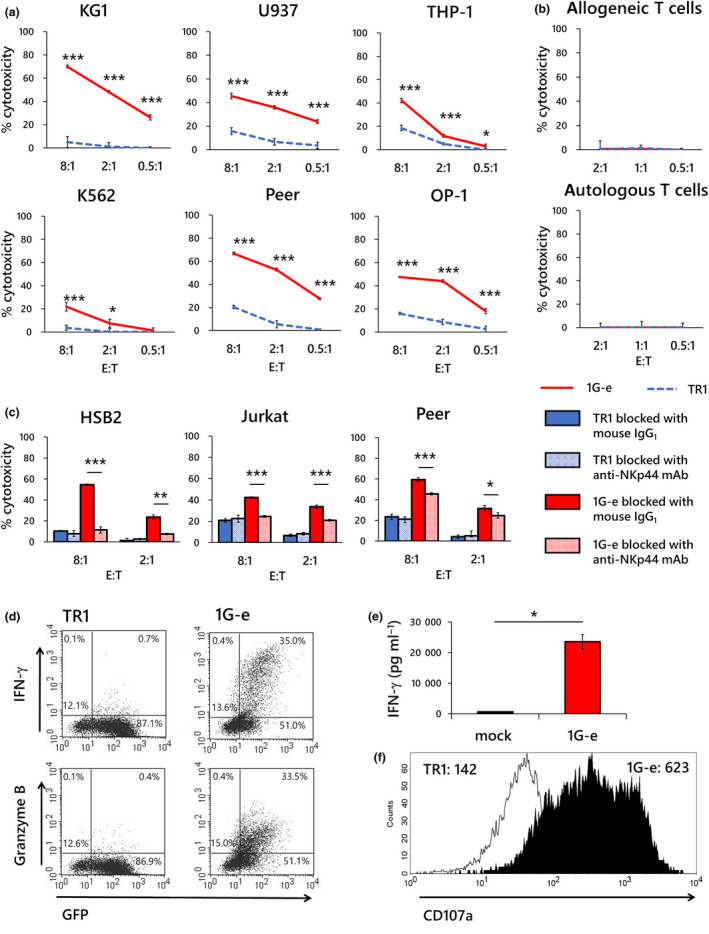
Specific response of NKp44‐based CAR‐transduced T cells to target exposure. (a) Specific cytotoxicity in a 4‐h killing assay against a variety of leukaemia cell lines was examined in first‐generation NKp44‐based CAR‐T cells (1G‐e; red solid line). T cells transduced with NKp44‐based CAR lacking signalling domain (TR1; blue dotted line) served as a control. The 1G‐e CAR‐T cells demonstrated significantly higher cytotoxic effects than T cells with non‐signalling CAR (TR1), which showed marginal or negligible cytotoxicity. (b) Neither the 1G‐e CAR‐T cells (red solid line) nor T cells with non‐signalling CAR (TR1; blue dotted line) showed cytotoxicity against autologous or allogeneic T cells. (c) A blocking assay was conducted in a 4‐h killing assay using anti‐NKp44 monoclonal antibodies or mouse IgG1, κ isotype control, with the 1G‐e CAR‐T cells and T cells with non‐signalling CAR (TR1), respectively. Cytotoxic effects were significantly attenuated after blocking with anti‐NKp44 monoclonal antibodies compared to the isotype control antibody in each assay. A blocking assay was conducted in a 4‐h killing assay using anti‐NKp44 monoclonal antibody, with T cells with NKp44‐based CAR (1G‐e) and T cells with non‐signalling control CAR, respectively. Cytotoxic effects were significantly attenuated after blocking in each assay. (d) The intracellular production of IFN‐γ and granzyme B was assessed using PE‐conjugated monoclonal antibodies and flow cytometry after 24‐h exposure to target cells (K562) in the 1G‐e CAR‐T cells and T cells with non‐signalling CAR (TR1). The NKp44‐based CAR‐T cells produced intracellular IFN‐γ and granzyme B, while non‐signalling control T cells did not. (e) Secretion of IFN‐γ was assessed by ELISA after 24‐h exposure to target cells (K562) in the 1G‐e CAR‐T cells (red square) and T cells transduced with empty vector (mock; open square). The 1G‐e CAR‐T cells produced significantly higher levels of IFN‐γ than mock‐transduced T cells. (f) Degranulation after exposure to target cells was assessed by CD107a mobilisation, which was detected using PE‐conjugated anti‐CD107a monoclonal antibodies and flow cytometry in the 1G‐e CAR‐T cells (filled area) and T cells with non‐signalling CAR (TR1; open area). The values of MFI are presented. NKp44‐based CAR‐T cells showed increased CD107a signal levels compared with the non‐signalling control. The experiments for a, b, c and e were performed in triplicates, and their results are shown as mean ± SD. The levels of statistical difference are shown using asterisks (*P < 0.05, **P < 0.01, ***P < 0.001). The data are representative of three independent experiments using different peripheral blood donors.