
Figure 6.
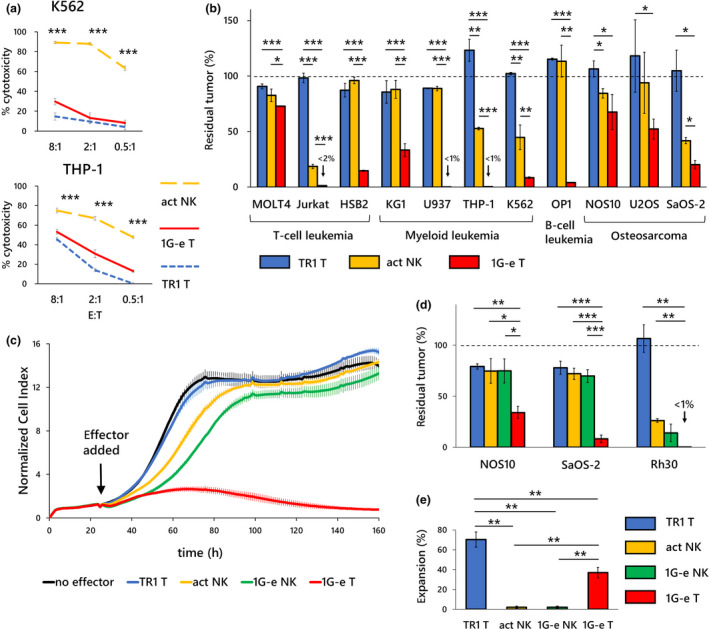
Comparisons with activated primary NK cells and NKp44‐based CAR‐NK cells. (a) Primary NK cells that were ex vivo‐activated by co‐culture with K562‐mb15‐41BBL (act NK; orange dashed line) showed significantly higher cytotoxicity against K562 and THP‐1 cells in a 4‐h killing assay than first‐generation NKp44‐based CAR‐T cells (1G‐e T: solid line). T cells with non‐signalling CAR (TR1 T; blue dashed line) served as control, although non‐specific effects at the E:T ratio of 8:1 are seen against THP‐1 cells. (b) On the contrary, in a long‐term (7 days) co‐culture assay, 1G‐e CAR‐T cells (1G‐e T; red square) exerted, in most of the cell lines, significantly stronger inhibitory effects on tumor growth than activated NK cells (act NK; orange square). Activated NK cells showed modest but significantly higher anti‐tumor effects than T cells with non‐signalling CAR (TR1 T; blue square) in only 4 of 11 cell lines. E:T ratios for leukaemia cell lines and solid tumor cell lines were 0.5:1 and 4:1, respectively. (c) In a long‐term cytotoxicity assay using iCELLigence real‐time cell analyser, both 1G‐e CAR‐NK cells (1G‐e NK; green line) and non‐transduced NK cells (act NK; orange line) showed enhanced inhibitory effects on tumor growth in the target cells (NOS10), as compared to T cells with non‐signalling CAR (TR1) or no effector cells, in the first 80 h. CAR‐NK showed more enhanced cytotoxicity than non‐transduced NK cells. However, the differences in inhibitory effects among CAR‐NK, non‐transduced NK and control T cells became negligible in the later stage (80‐160 h). In contrast, the 1G‐e CAR‐T cells (1G‐e T; red line) were able to continuously kill the tumor cells and completely abrogate tumor cell growth. (d) The 1G‐e CAR‐T cells (1G‐e T; red square) showed significantly higher anti‐tumor effects against osteosarcoma (NOS10 and SaOS‐2) and rhabdomyosarcoma (Rh30) cells than the 1G‐e CAR‐NK (1G‐e NK; green square) and non‐transduced NK (act NK; orange square) cells, as measured by the WST‐8 assay at an E:T ratio of 4:1. In this assay, inhibitory effects on tumor growth were not statistically different between CAR‐NK and non‐transduced NK cells. (e) Effector cell expansion (recovery) after 7 days of co‐culture with tumor cells was investigated to see whether a difference in persistence of effector cells might explain the difference in long‐term anti‐tumor effects. The 1G‐e CAR‐T cells (1G‐e T; red square) showed a significantly prolonged survival, after a single exposure to the target cells (50Gy‐irradiated THP‐1), as compared to 1G‐e CAR‐NK cells (1G‐e NK; green square) or non‐transduced NK cells (act NK; orange square). TR1 CAR‐T cells served as control, which indicated more survival than 1G‐e CAR‐T cells because of lack of activation‐induced cell death. Data are means ± SD of three technical replicates. Experiments were independently repeated at least twice, and representative data are shown. *P < 0.05, **P < 0.01, ***P < 0.001.