Figure 7.

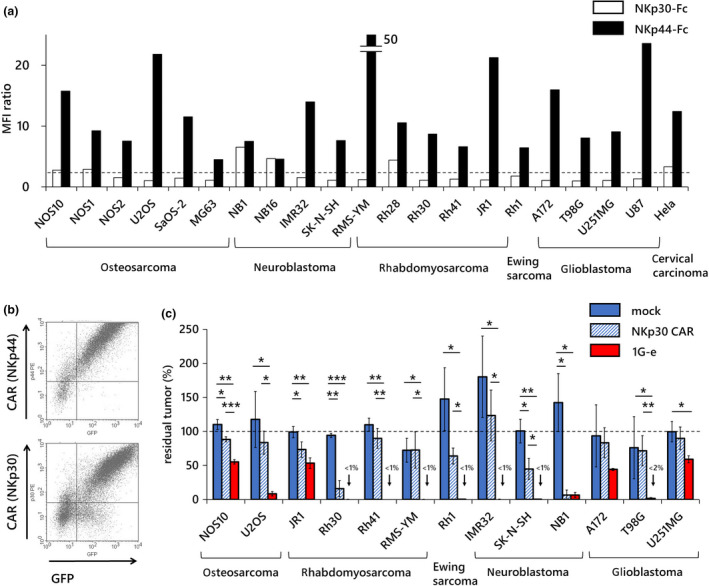
Comparisons with NKp30‐based CAR‐T cells. (a) Surface expression of ligands for NKp44 and NKp30 on various solid tumor cells was examined using NKp44‐Fc or NKp30‐Fc chimera protein, respectively, followed by staining with PE‐conjugated secondary antibodies. The vertical axis indicates the ratio of MFI of NKp44‐Fc/control Fc (filled square) or NKp30‐Fc/control Fc (open square). An MFI ratio of more than 2 was considered positive. While NKp44 was considered positive in 21 of 21 cell lines, NKp30 was considered positive in only six of 21 cell lines. (b) Surface expression levels of CAR in NKp44‐based CAR‐T cells (1G‐e; upper) and in NKp30‐based CAR‐T cells (lower) were similar. (c) NKp30‐based CAR‐T cells (NKp30 CAR; blue shaded square) showed no or only mild anti‐tumor effects in long‐term co‐culture assay at an E:T ratio of 1:1 against various solid tumor cell lines tested, except for a few cell lines (Rh30, SK‐N‐SH and NB1). NKp44‐based CAR‐T cells (1G‐e; red square) showed significantly stronger anti‐tumor effects than NKp30‐based CAR‐T cells against most cell lines. T cells transduced with an empty vector (mock; blue square) served as the control. The y‐axis shows the percentage of residual tumors (as compared with tumor cells without effector cells). Data are means ± SD of three technical replicates. Experiments were independently repeated at least twice, and representative data are shown. *P < 0.05, **P < 0.01, ***P < 0.001.
