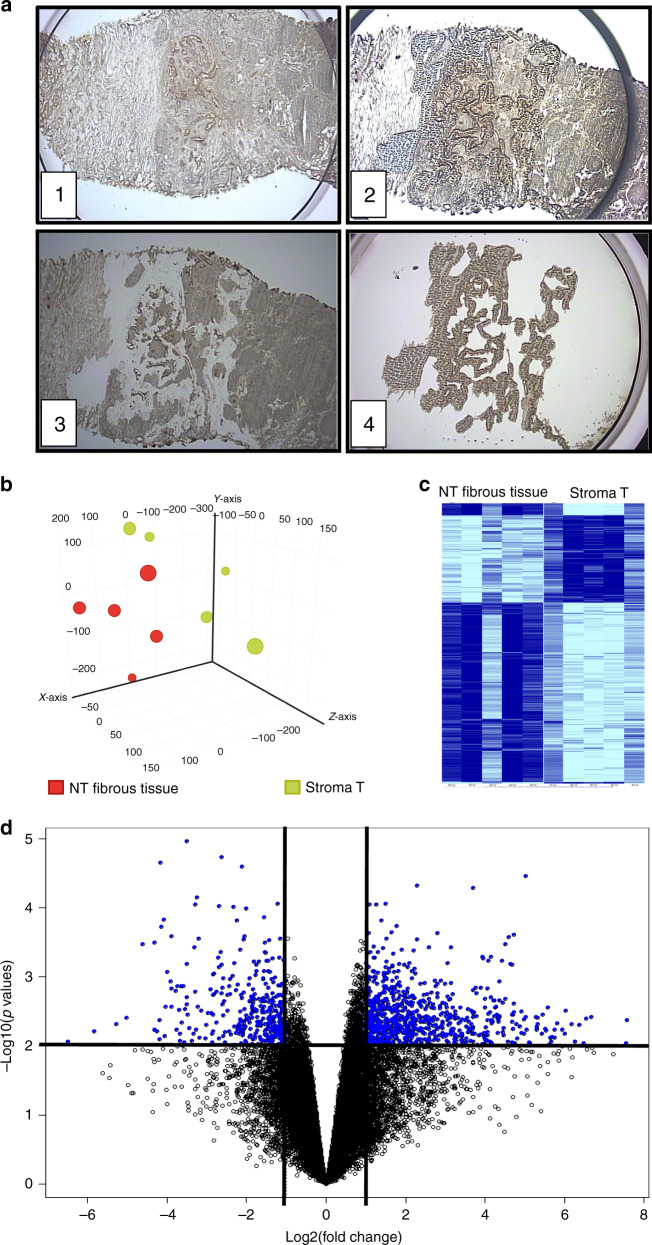
Fig. 1. Gene expression profiling of microenvironment in PDAC.
a Screenshots during 4 steps of LCM procedure: (1) Focusing the device on tumour area on fresh frozen tissue, a cap coated with an adhesive surface is positioned. (2) Cap in position on tissue after laser pulsed procedure. (3) Residual tissue on slide with laser dissection. (4) Selected microenvironment area on thermoplastic film of the cap. b Principal component analysis of global transcriptomic profiles of the five samples of stroma and five associated NT fibrous tissues. c Clustering analysis of genes differentially expressed between the T stroma and the surrounding NT fibrous tissue. d Volcano plot of 1256 non-redundant genes differentially expressed between the stroma and the surrounding NT fibrous tissue. Following microarray analysis of the 5 frozen PDAC from the testing set, genes were selected based on the significance of the differential gene expression in the T stroma versus the surrounding NT fibrous tissue (horizontal line; p < 0.01) and the level of induction or repression (vertical lines; fold change >2).

