Figure 3.
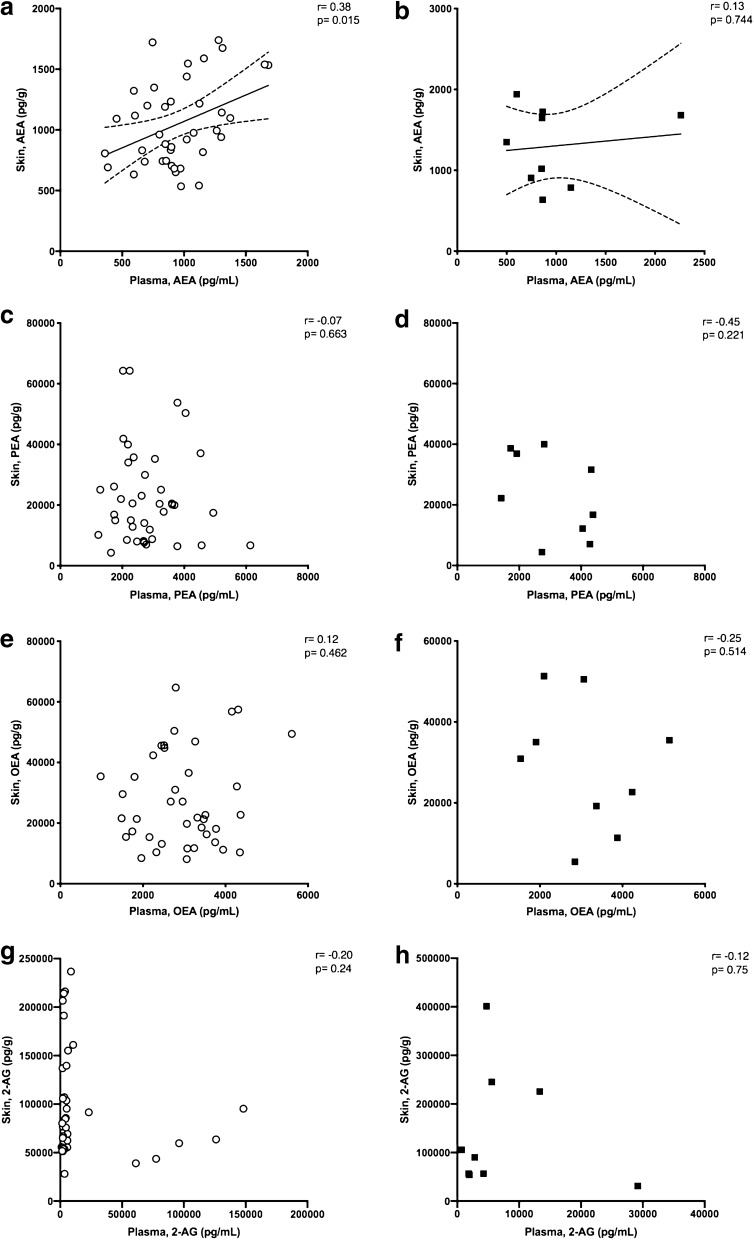
Concentration of endocannabinoids and related NAEs in plasma and skin. Relationship between the concentrations of AEA in (a) normal scars and (b) hypertrophic scars; PEA in (c) normal scars and (d) hypertrophic scars; OEA in (e) normal scars and (f) hypertrophic scars; and 2-AG in (g) normal scars and (h) hypertrophic scars in the plasma and skin of patients who developed normal and hypertrophic scars. A positive correlation with a Pearson r of 0.38 (p = 0.0152) with a linear regression slope of 0.44 ± 0.17, including a 95% confidence limit, was found for AEA in patients who developed normal scars (a). No significant correlation was found for AEA in patients who developed HT scars (b). No significant correlation was found for PEA (c, d), OEA (e, f), and 2-AG (g, h) in either group of patients.

