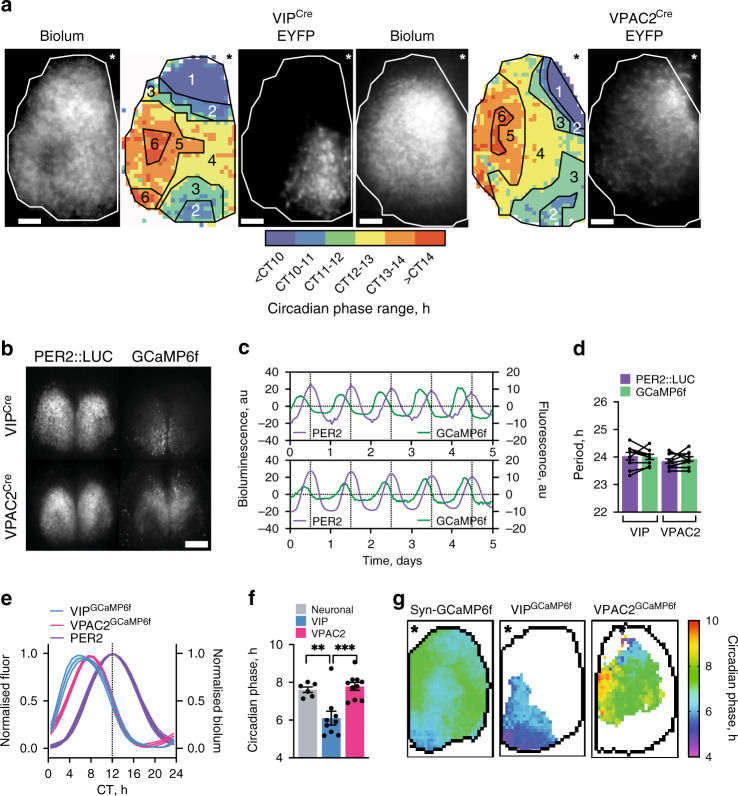
Fig. 1. Regional distribution and circadian phase of VIPCre and VPAC2Cre cells in SCN.
a Registration of VIPCre and VPAC2Cre cells to corresponding phase maps of SCN spatiotemporal bioluminescent wave. For both cell types, left panel shows projections of average bioluminescence emissions recorded by CCD; middle panel shows the corresponding phase map categorically coloured as 1-h phase bins overlaid with manually annotated sequential phase clusters; and right panel shows distribution of Cre-expressing cells revealed by Cre-conditional EYFP intensity. The perimeter of the SCN is delineated by the white outline, and the location of the third ventricle is denoted by asterisks. Note registration of VIPCre and VPAC2Cre cells with earlier and later phase clusters, respectively. These images are representative of a set of three experiments for VIPEYFP and VPAC2EYFP each, which are presented in Supplementary Fig. 3. Scale bars = 50 µm. b Representative micrographs of Per2::Luciferase in register with GCaMP6f conditionally targetted to VIP (upper) or VPAC2 (lower) cells. Scale bars = 250 µm. c Representative detrended Per2::Luciferase (purple) and conditionally targetted GCaMP6f traces (green) from recordings from VIPCre (upper) and VPAC2Cre (lower) slices. d Paired period measures of Per2::Luciferase (purple) and conditional GCaMP6f (green) rhythms. e Phase-aligned normalised single cycles of Per2::Luciferase (two overlaid purple) versus corresponding VIPGCaMP6f (blue) and VPAC2GCaMP6f (pink) cycles. Lines and shading are mean ± SEM. f Circadian-normalised phase measures for pan-neuronal GCaMP6f (grey), VIPGCaMP6f (blue) and VPAC2GCaMP6f (pink), (**p = 0.004, ***p = 0.0005). g Circadian-normalised phase-maps of neuronal GCaMP6f (left), VIPGCaMP6f (middle) and VPAC2GCaMP6f (right). SCN outlines from corresponding Per2::Luciferase phase-maps, asterisks mark third ventricle. In all histograms, individual points represent individual SCN slices and bars are mean ± SEM. Statistics: d paired two-tailed t-tests; f ordinary one-way ANOVA with Holm-Sidak’s correction for multiple comparisons. For GCaMP6f imaging (d–f): n = 6, 9 and 10 for neuronal, VIPGCaMP6f and VPAC2GCaMP6f. Only significant comparisons (p < 0.05) are shown. Source data are provided as a source data file.

