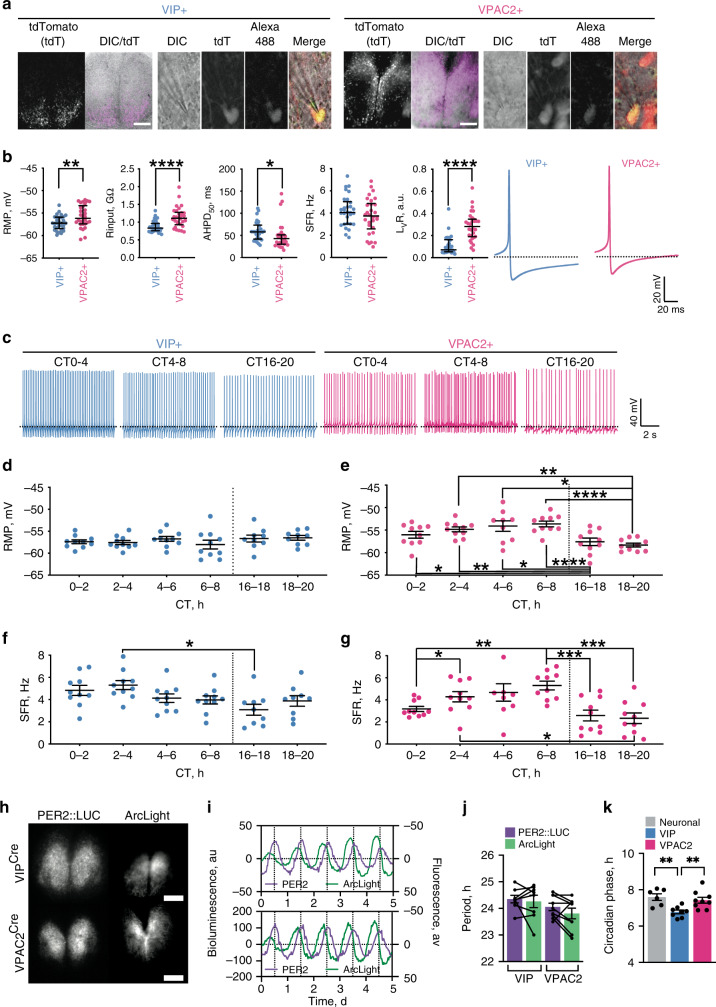
Fig. 2. Electrophysiological characterisation of VIPCre and VPAC2Cre neurons.
a VIP and VPAC2 cells in SCN slices, targetted for recording by Cre-conditionally expressed TdTomato, which was further confirmed by Biocytin-Alexa488 filling of the cells. Scale bar = 250 µm. b Summary generic cellular electrophysiological properties from current clamp recordings (pooled by slice) made from VIP (blue) or VPAC2 (pink) cells pooled across all circadian times. From left to right: resting membrane potential (RMP), input resistance (Rinput), after hyperpolarisation half duration (AHPD50), spontaneous firing rate (SFR) and firing regularity (LvR) followed by representative individual action potential waveforms. Each point represents the mean value for an individual slice (n = 30 slices per genotype, mean of 12 cells per slice), and lines represent median of the slices ±IQR (*p = 0.045, **p = 0.003, ****p < 0.0001). c Example current clamp recordings for VIP (blue) and VPAC2 (pink) cells made during day-time (CT0-4, CT4-8) and night-time (CT16-20) (dotted line: −55 mV). d–g Phase-aligned recordings of: d, e RMP of VIP (d) and VPAC2 cells; f, g SFR for VIP (f) and VPAC2 (g); Blue and pink represent VIP and VPAC2 respectively (*p < 0.05, **p < 0.01, ***p < 0.001, ****p < 0.0001). h Representative micrographs of Per2::Luciferase in register with ArcLight conditionally targetted to VIP (upper) or VPAC2 (lower) cells. Scale bars = 250 µm. i Representative detrended Per2::Luciferase (purple) and conditionally targetted inverted ArcLight traces (green) from recordings from VIPCre (upper) and VPAC2Cre (lower) slices. j Paired period measures of Per2::Luciferase and conditional ArcLight rhythms. k Circadian-normalised phase measures of peak depolarisation for pan-neuronal ArcLight (grey), VIPGCaMP6f (blue) and VPAC2GCaMP6f (pink) (**p < 0.01). In all histograms, each point represents the mean value for an individual slice, while the histogram bar/line represents the mean for all of the slices ±SEM. For time-aligned electrophysiology (d–g): pooled slice level data for n = 10 slices per genotype per time point (except for VIP CT16-18, VIP CT18-20, and VPAC2 CT4-6, where n = 9 slices per genotype per time point); for ArcLight imaging (j, k): n = 6, 8 and 9 for pan-neuronal, VIPArcLight and VPAC2ArcLight. Statistics: b, d–g linear mixed model followed by: b Two-tailed Mann–Whitney U test; d–g two-way ANOVA with Tukey’s correction for multiple comparisons; j paired two-tailed t-test; k ordinary one-way ANOVA with Holm-Sidak’s correction for multiple comparisons. Only significant comparisons (p < 0.05) are shown. Source data are provided as a source data file.

