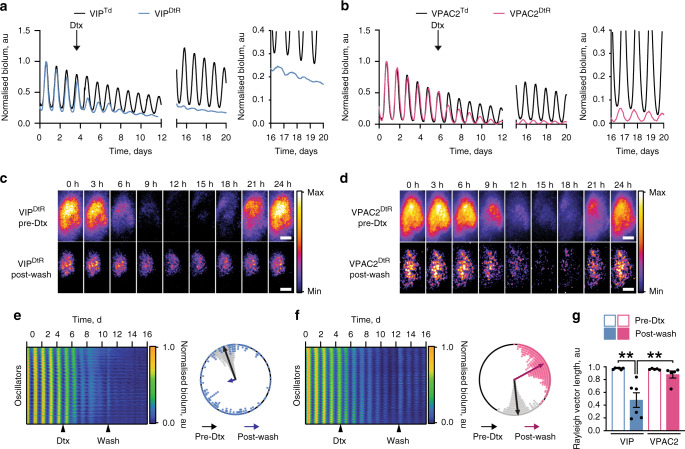
Fig. 4. Differential contributions of VIP cells and VPAC2 cells to SCN circuit-level function revealed by their specific toxin-mediated ablation.
a, b Representative normalised Per2::Luciferase traces for (a) VIPCre SCN and (b) VPAC2Cre SCN conditionally expressing either TdTomato (Black) or the diphtheria toxin receptor (DtR) (VIPCre: blue, VPAC2Cre: pink). The traces show ongoing ensemble oscillation before, during and after wash-out of diphtheria toxin (Dtx) addition, and the insets to the right show expanded views of the oscillations post-washout. c, d Bioluminescent micrographs of a single cycle of bioluminescence for (c) VIPDtrR and (d) VPAC2DtR SCN before addition of Dtx (upper) and post-washout (lower). Scale bars = 100 µm. e, f Raster plots showing cellular bioluminescence intensity through time for (e) VIPDtR and (f) VPAC2DtR SCN recordings conditionally expressing DtR before, during and after addition of Dtx. Alongside are representative Rayleigh plots of the corresponding slices showing phase-coherence before addition of Dtx (black) and post-washout (VIPCre: blue; VPAC2Cre: pink). Individual points represent individual oscillator circular phases; arrows represent mean circular phase for the slice and condition. g Summary Rayleigh vector lengths before Dtx treatment (hollow bars) and post-washout (solid bars) for VIPCre (blue, n = 6) and VPAC2Cre (pink, n = 5) SCN conditionally expressing DtR (**p < 0.01). Individual points represent individual slice values; bars represent mean ± SEM. Statistics: g repeated-measures two-way ANOVA with Sidak’s correction for multiple comparisons. Only significant comparisons (p < 0.05) are shown. Source data are provided as a source data file.

