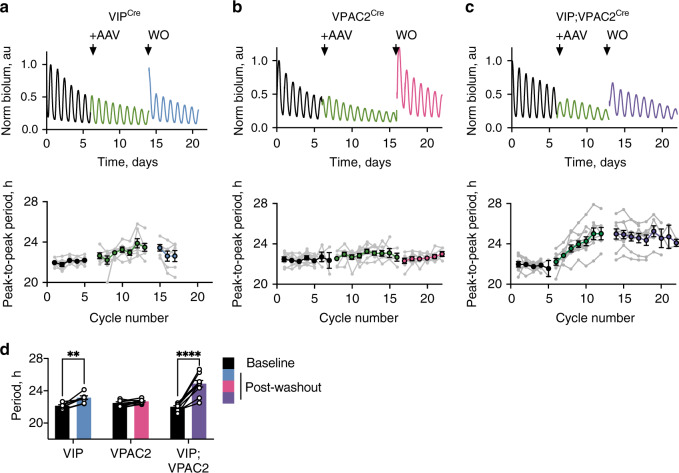
Fig. 6. Conditional Cry1 expression in the VIP-VPAC2 cellular axis of Cry1-null SCN is sufficient to determine ensemble period of the SCN.
a, c Upper: representative raw Per2::Luciferase PMT traces of Cry1-null SCN before (black) and during (green) initiation of conditional Cry1-expression, and following AAV washout (WO) (coloured by genotype: VIPCre (blue), VPAC2Cre (pink) and VIPCre;VPAC2Cre (purple)). Lower: corresponding peak-to-peak period plots (mean ± SEM) for VIPCre, VPAC2Cre and VIPCre;VPAC2Cre SCN. Arrow indicates addition of conditional Cry1 AAV. For peak-to-peak period plots, joined grey points represent individual slices; coloured points represent mean ± SEM with colours denoting treatment interval in traces as above. d Summary period data for: pre-AAV-Cry1 baseline (black) and post-AAV-Cry1 washout for VIPCre (blue), VPAC2Cre (pink) and VIPCre;VPAC2Cre (purple) SCN (**p = 0.007, ****p < 0.0001). Histograms: paired points represent individual slices; bars represent mean ± SEM (n = 7, 9 and 10 for VIPCre, VPAC2Cre and VIPCre;VPAC2Cre). Statistics: d repeated-measures two-way ANOVA with Sidak’s correction for multiple comparisons. Only significant comparisons (p < 0.05) are shown. Source data are provided as a source data file.

