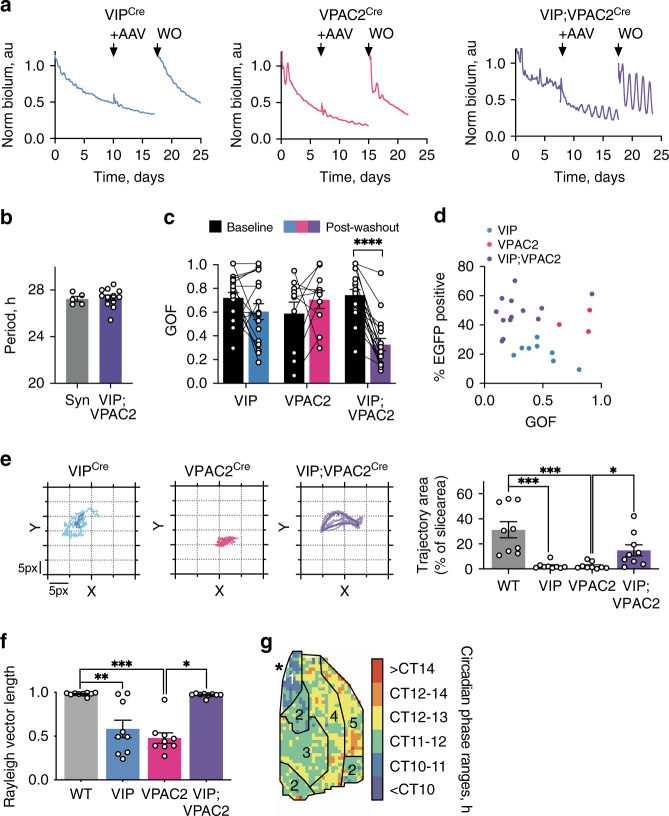
Fig. 7. Conditional Cry1 expression in the VIP-VPAC2 cellular axis of Cry-null SCN is sufficient to initiate and sustain circadian rhythmicity.
a Representative Per2::Luciferase PMT traces of Cry-null SCN, before and during initiation of conditional Cry1-expression, and after AAV washout (WO) in VIPCre (blue, left), VPAC2Cre (pink, middle) and VIPCre;VPAC2Cre slices (purple, right). Arrows indicate AAV addition and washout. b Summary periods for pan-neuronal (Syn, grey, n = 5) or VIPCre;VPAC2Cre (purple, n = 12) Cry1 expression. c Paired goodness of fit (GOF) measures for baseline (black) and post-washout (coloured) for VIPCre (blue, n = 18), VPAC2Cre (pink, n = 10) and VIPCre;VPAC2Cre (purple, n = 17) SCN (p < 0.0001). d Percentage of Cry1::EGFP positive SCN cells versus the GOF for VIPCre (blue, n = 8), VPAC2Cre (pink, n = 3) and VIPCre;VPAC2Cre (purple, n = 13) conditional Cry1-expressing SCN. e Representative CoL trajectories showing relative spatial organisation of VIPCre (blue, n = 9), VPAC2Cre (pink, n = 9) and VIPCre;VPAC2Cre (purple, n = 9) in Cry-null SCN conditionally expressing Cry1 (left) alongside summary trajectories (right) including wild type (grey, n = 9) (*p = 0.047, ***p < 0.001). Lighter lines indicate individual cycles, darker lines indicate the mean of the individual cycles. f Summary Rayleigh vector length for wild-type SCN (grey, n = 9), or VIPCre (blue, n = 9), VPAC2Cre (pink, n = 9) and VIPCre;VPAC2Cre (purple, n = 9) Cry-null SCN conditionally expressing Cry1 (*p = 0.027, **0.004, ***p = 0.0002). g Representative categorical, annotated phase map showing spatial phase distribution in VIPCre;VPAC2Cre Cry1-initiated SCN, asterisk indicates third ventricle. In all plots: Individual points (paired/unpaired) represent individual slices; bars represent mean ± SEM. Statistics: b unpaired two-tailed t-test, c repeated-measures two-way ANOVA; e, f Ordinary one-way ANOVA. Only significant comparisons (p < 0.05) are shown. Source data are provided as a source data file.

