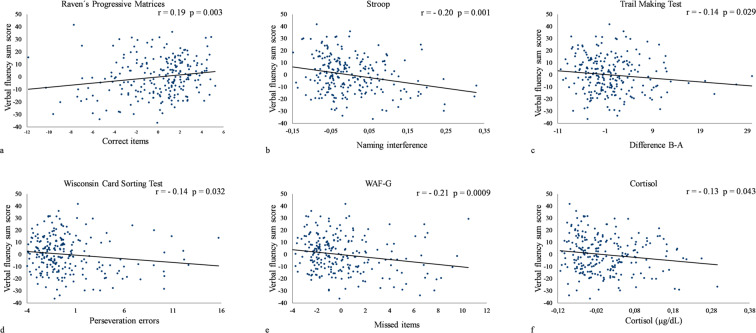
Figure 1.
Plots of significant correlations of executive function tests and total verbal fluency sum score. The performance in verbal fluency task is represented by the total number of correct words produced across all three semantic VF tasks (t1 + t2 + t3).The negative correlation in plot b-f are due to the divergent direction of the scores since these variables describe different types of errors, reaction or process times (the higher the worse the performance) while the performance in the verbal fluency is represented by the total amount of correct items (the higher the better).

