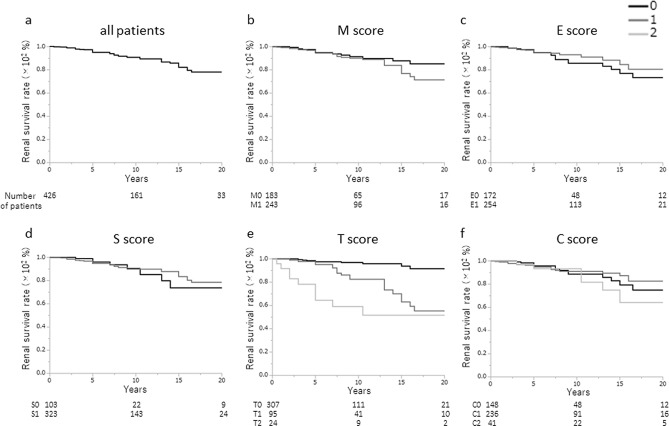
Figure 3.
Renal survival rates of the treatment group. (a) The renal survival rate of treatment group was 90.6% at 10 years and 78.0% at 20 years, and they were similar for the (b) M0 (83.0%) and M1 (70.5%) categories (p = 0.2125), (c) E0 (73.4%) and E1 (80.5%) categories (p = 0.8183) and (d) S0 (73.8%) and S1 (78.4%) categories (p = 0.9111). (e) The 20-year renal survival rates were 90.6% for T0, 55.4% for T1, and 51.7% for T2, which were significantly different among the three groups (p < 0.0001). The renal survival rate was significantly higher for T0 than T1 (p < 0.0001) or T2 (p < 0.0001). The renal survival rate for T1 was significantly higher than for T2 (p = 0.0165). (f) The 20-year renal survival rate was not significantly different among the three C-score groups (C0, 74.9%; C1, 82.6%; C2, 64.2%; p = 0.4954). The renal survival rate for the C0 category was similar to that for C1 (p = 0.6672) and for C2 (p = 0.4924). The renal survival rate for C1 was similar to that for C2 (p = 0.2219).

