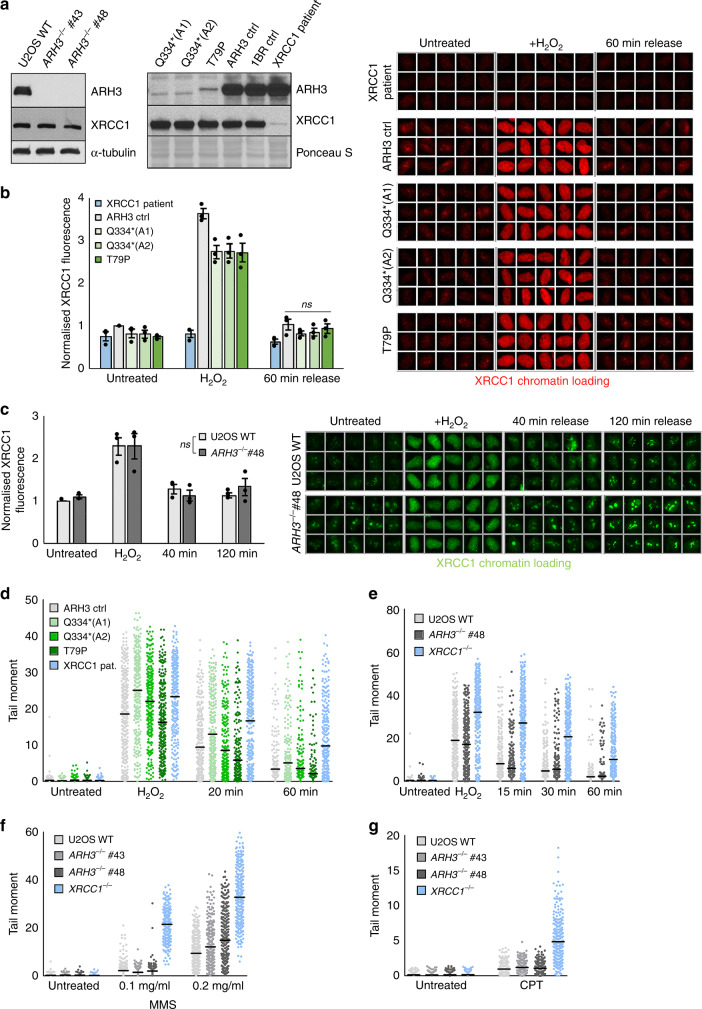
Fig. 1. Normal rates of DNA single-strand break repair in ARH3-defective cells.
a ARH3 and XRCC1 protein levels in the indicated U2OS (left) and patient-derived fibroblasts (right) were measured by western blotting. b XRCC1 chromatin binding measured by indirect immunofluorescence in detergent pre-extracted control and patient fibroblasts before, immediately after 10 min treatment with 150 μM H2O2 on ice, and after 60 min release in H2O2-free medium. Representative ScanR images (right) and quantification using ScanR software (left) are shown. Statistical analysis (two-tailed t-test) is indicated (ns not significant). c Similar experiment to (b); wild-type and ARH3−/− U2OS cells were treated for 10 min or not with 2 mM H2O2 on ice, followed by a repair period of 40 min or 120 min in H2O2-free medium. Data are as in panel b and both are the mean ± SEM of three biologically independent experiments. Statistical analysis (two-way analysis of variance) is indicated. The samples are not significantly different (ns). d DNA strand breakage quantified by alkaline comet assays in the indicated control and patient fibroblasts before, immediately after treatment with 50 μM H2O2 on ice, and after the indicated repair periods in H2O2-free medium. e Similar experiment to d; wild-type, ARH3−/−, and XRCC1−/− U2OS cells were treated with 100 μM H2O2 followed by a repair period of 15, 30, and 60 min in H2O2-free medium. f Alkaline comet tail moments in wild-type, ARH3−/− and XRCC1−/− U2OS cells before and after 20 min treatment with indicated doses of MMS. g Alkaline comet tail moments in wild-type, ARH3−/− and XRCC1−/− U2OS cells before and after 45 min treatment with 10 μM CPT. Data for d, e, f, and g are comet tail moments of 300 cells examined over three independent experiments (100 cells each), horizontal bars show the average. The only significantly different sample in each dataset is XRCC1−/− U2OS (two-way analysis of variance). Representative pictures are shown in Supplementary Fig. 2.

