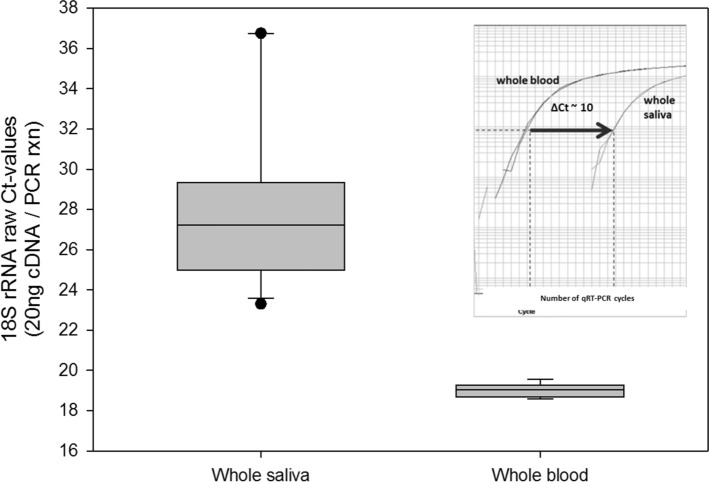
Figure 2.
The box plots display the 18S rRNA raw Ct-values for both whole saliva (n = 12) and whole blood (n = 6) samples. Of note, the input amount for cDNA synthesis for each sample was 1 µg and the amount of cDNA input for qRT-PCR was 20 ng—regardless of whether saliva or blood was used. For an example, amplification plots for 18S rRNA are shown for one saliva sample and the corresponding blood sample as an inserted figure. Droplines (vertical dashed lines) provide the corresponding cycles required for the fluorescent signal to cross the threshold (Ct values). Ct values for detection of human 18S rRNA show a Ct-difference of about 10 Ct-values corresponding to 2^ 10 ~ 1,000-fold differences in RNA copy numbers.

