
Figure 3.
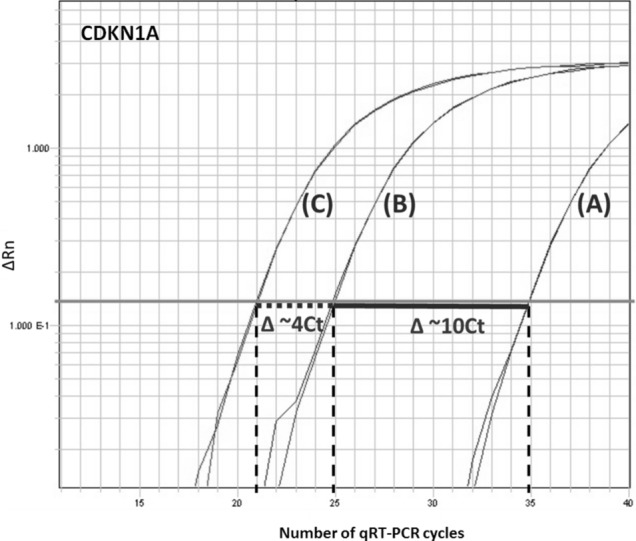
The figure depicts three exemplary amplification plots (unamplified, 10 × and 14 × pre-amplified) from one saliva sample (sample ID 7) and one gene (CDKN1A) created with the ABI PRISM 7900HT sequence detection system. The amplification plot (A) represents the unamplified sample, the one marked with (B) the 10 × pre-amplified sample and the one with (C) the 14 × pre-amplified sample. Droplines (vertical dashed lines) provide the corresponding cycles required for the fluorescent signal to cross the threshold (Ct values). Linearity of 10 × pre-amplification is shown as a ΔCt of 10 in horizontal solid line 1 (Ct (no-Amp)—Ct (14X pre-Amp)), and corresponding ΔCt of 4 in horizontal dotted line 2 (Ct (10X pre-Amp)—Ct (14X pre-Amp)). ΔRn (normalized reporter value): the Rn value of an experimental reaction minus the Rn value of the baseline signal.