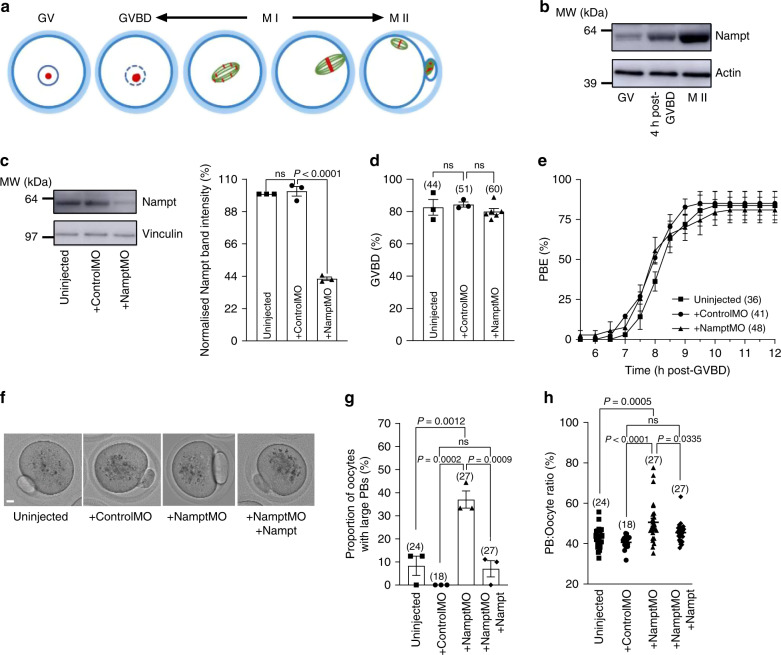
Fig. 1. Depletion of Nampt compromises asymmetry.
a Schematic depicting stages of meiotic maturation and asymmetric division in oocytes. b Western blot of endogenous Nampt levels during meiotic maturation; n = 30 oocytes per lane. Representative blot from three independent experiments is shown. c Uninjected, controlMO- and NamptMO-injected oocytes were immunoblotted for Nampt. Vinculin served as a loading control (left); n = 15 oocytes per lane. Experiments were repeated three times. Quantification of Nampt protein levels (right). d, e GVBD rates 2 h following release from IBMX (d) and PBE rates relative to time of GVBD (e) in uninjected, controlMO- and NamptMO-injected oocytes. f Brightfield images of representative uninjected, mock-depleted and Nampt-depleted oocytes as well as Nampt-depleted oocytes co-injected with recombinant Nampt. Scale bar, 10 μm. Representative images from three independent experiments are shown. g Proportion of oocytes with large PBs. See Methods for further details. h Ratio of PB width to oocyte diameter. Oocyte numbers are shown in parenthesis from three independent experiments (d, e, g, h). Data in graphs are presented as the mean ± SEM. Data points are shown in c, d and g. P-values are shown in the graphs, ns denoted P > 0.05. Statistical comparisons were made using one-way ANOVA in c, d, g and h. See also Supplementary Movie 1. Source data are provided as a Source Data file.

